×
模态框(Modal)标题
在这里添加一些文本
Close
Close
Submit
Cancel
Confirm
×
模态框(Modal)标题
×
ISSN 1004-0323
CN 62-1099/TP
RSS
|
Email Alert
Toggle navigation
Home
About Journal
Editorial Board
Instruction
Journal Online
Current Issue
Online First
Archive
Most Read
Most Download
Most Cited
Subscription
Advertisement
Publication Ethics
Contact Us
中文
Figure/Table detail
Analysis on Evolution of Ecological Vulnerability of Shanxi Province based on the Remote Sensing and GIS Technique
Huilin ZHANG, Weiguo WANG, Jian WANG, Xiaojiong ZHAO, Yanjun HOU, Yilan BO
Remote Sensing Technology and Application
, 2024, 39(
2
): 478-491. DOI:
10.11873/j.issn.1004-0323.2024.2.0478
数据
时间分辨率
空间分辨率
数据来源
降水
逐月
1 km
国家地球系统科学数据中心
气温
逐月
1 km
国家青藏高原数据中心
潜在蒸散发
逐月
1 km
MCD12Q1
逐年
1 km
NASA
DEM
-
30 m
地理空间数据云平台
NDVI
8日
1 km
中国科学院资源环境
科学与数据中心
人口密度
逐年
1 km
GDP
逐年
1 km
Table1
Basic information of data
Other figure/table from this article
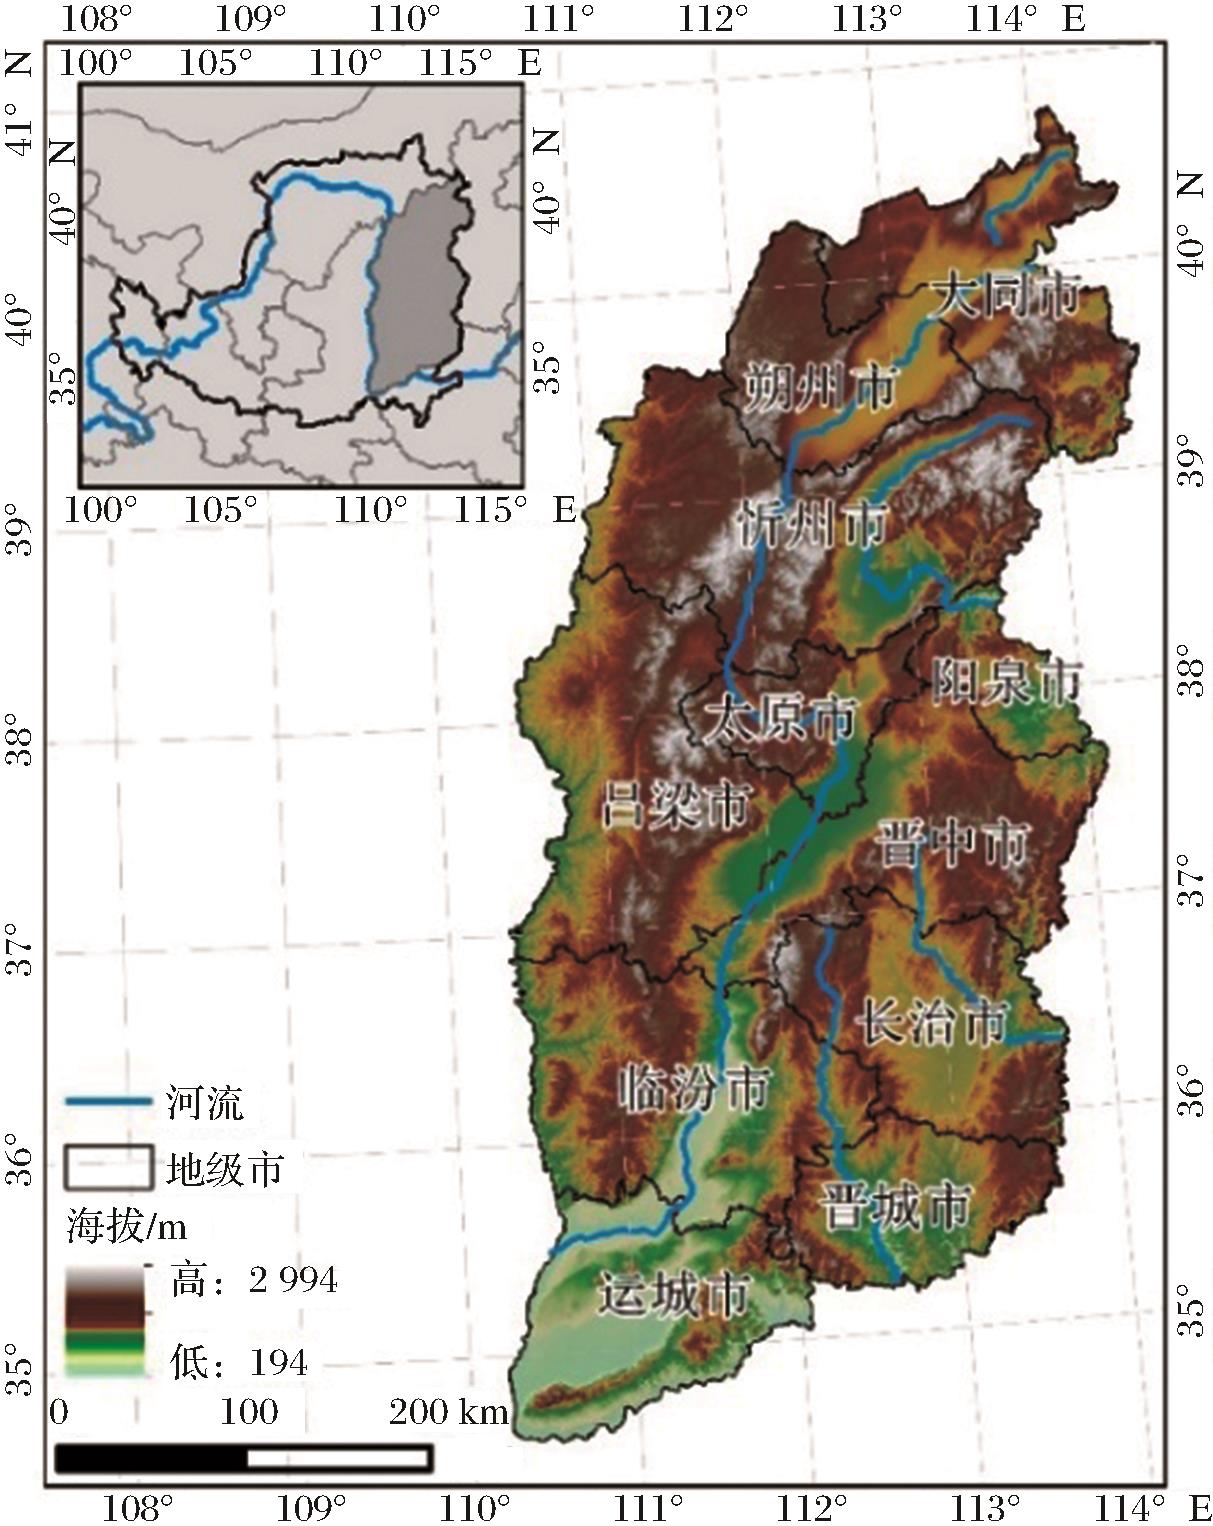
Fig.1
Location of study area
Table 2
The ecological vulnerability evaluation index system in the Shanxi Province
Table3
The division rules of ecological vulnerability
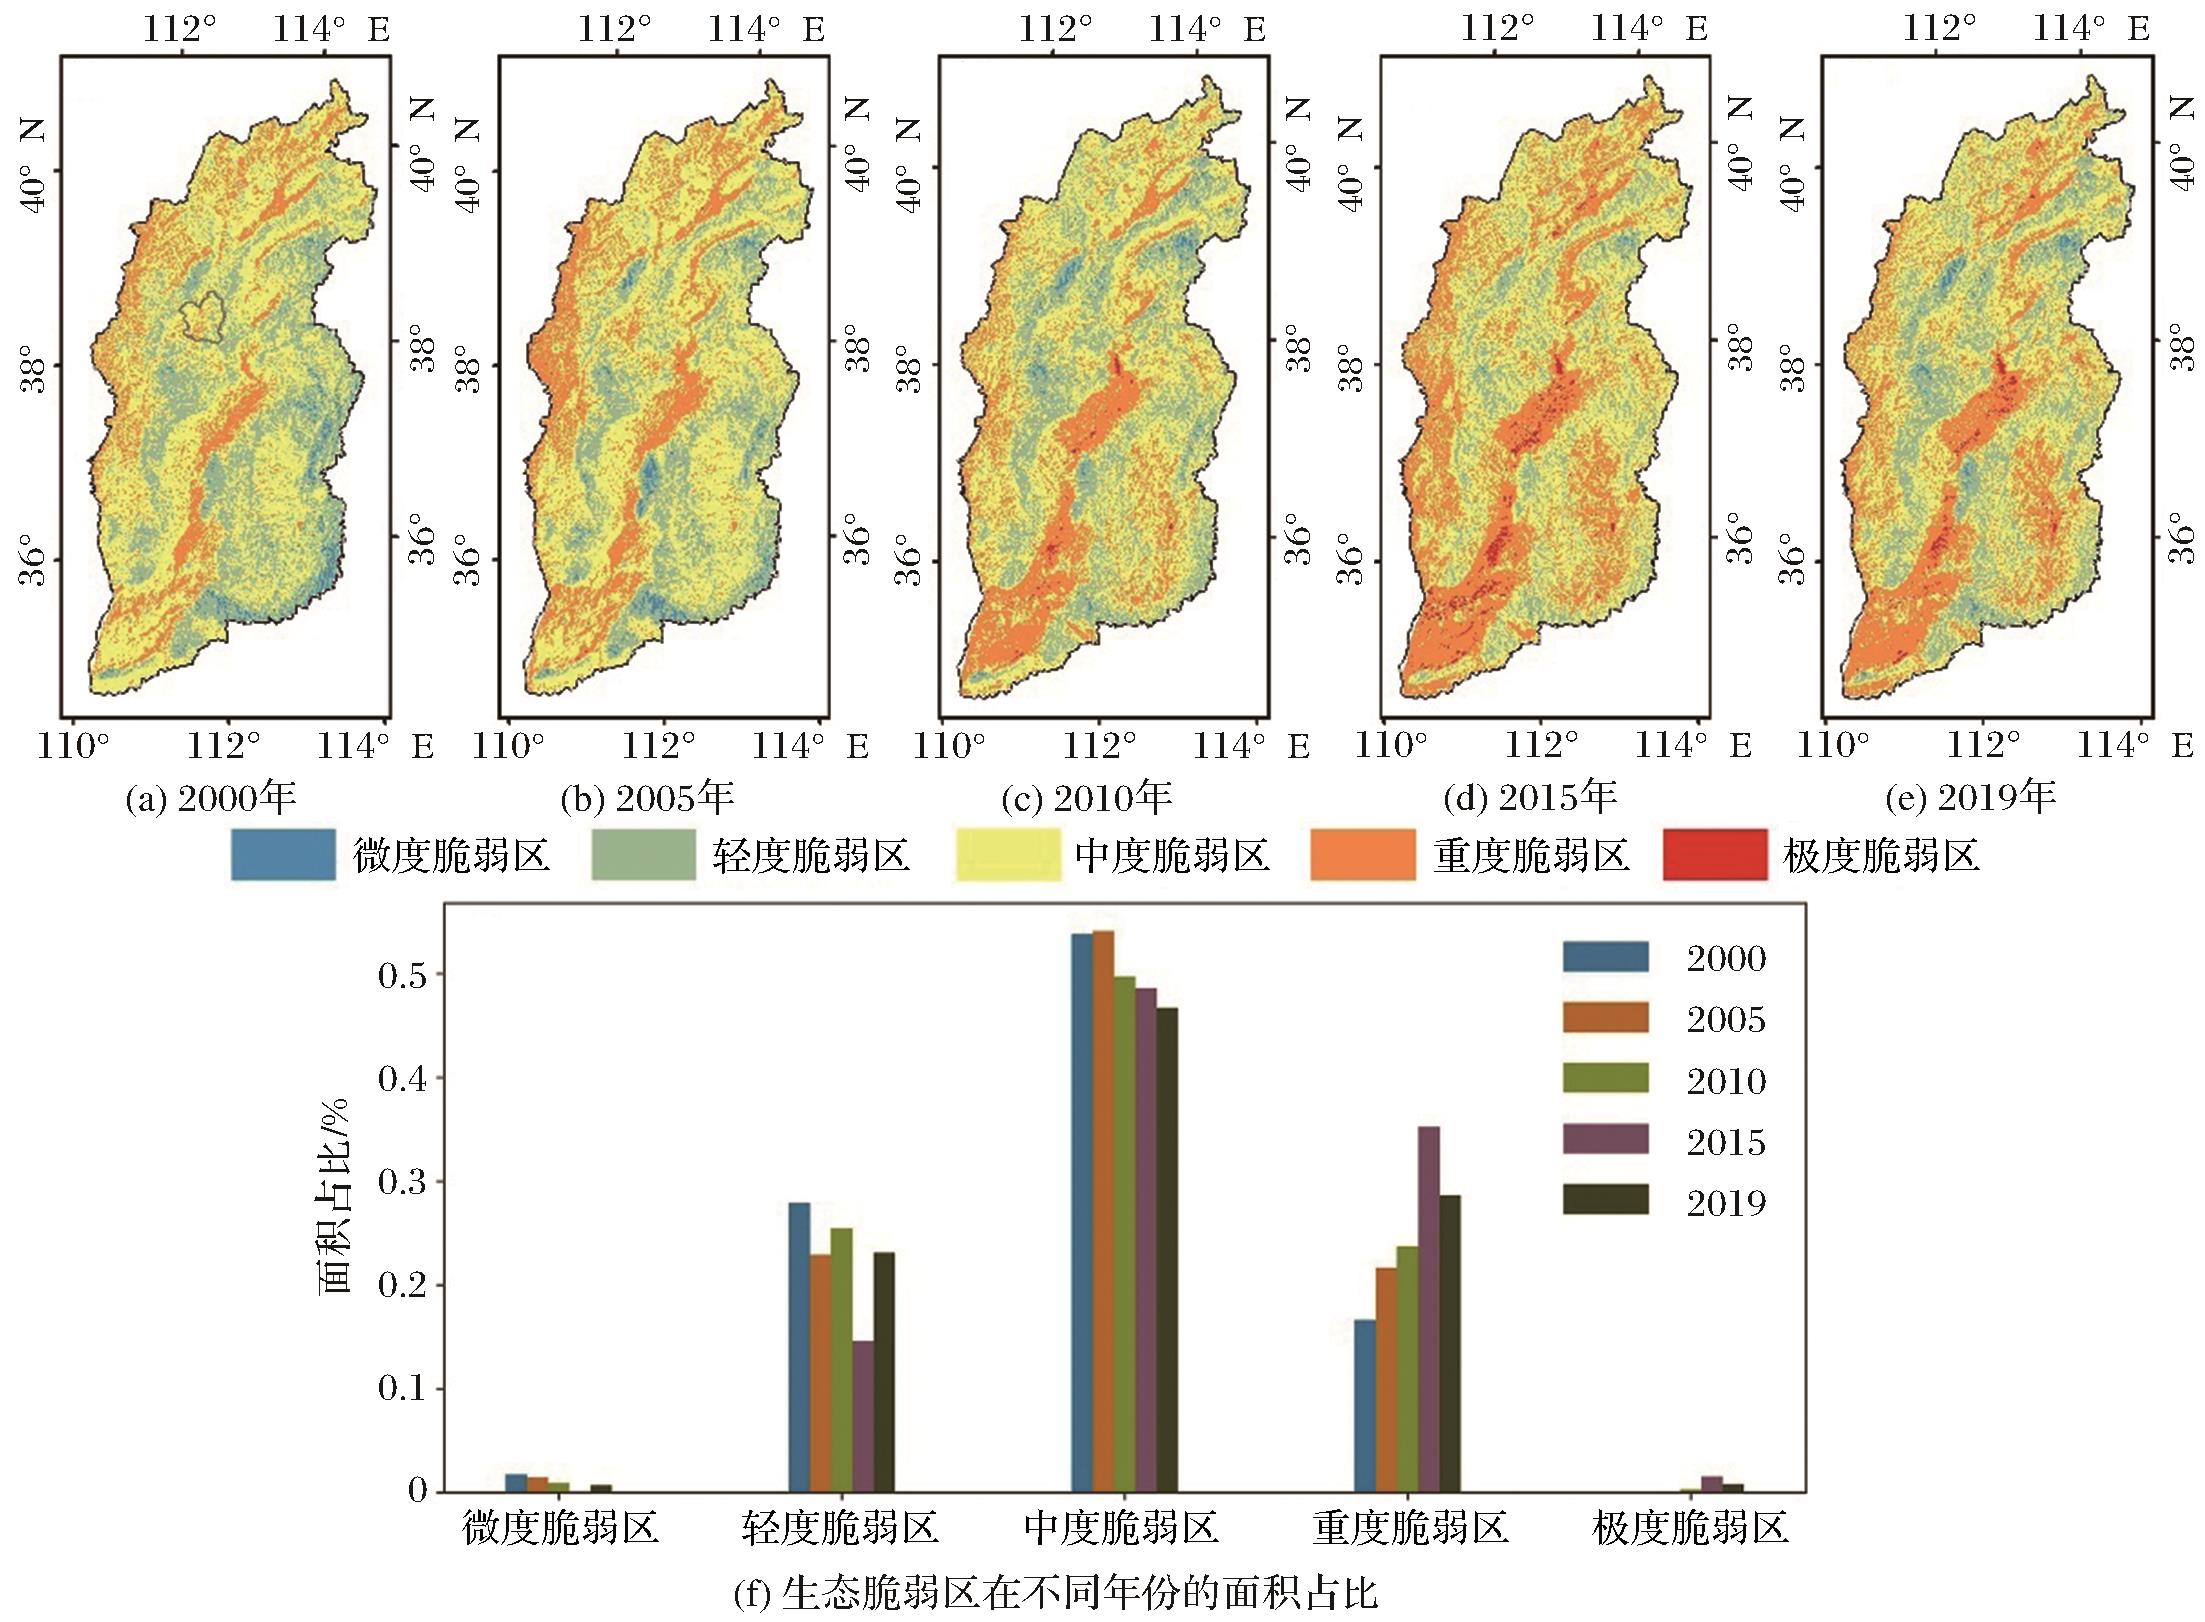
Fig.2
Spatial-temporal distribution characteristics of ecological vulnerability in Shanxi Province
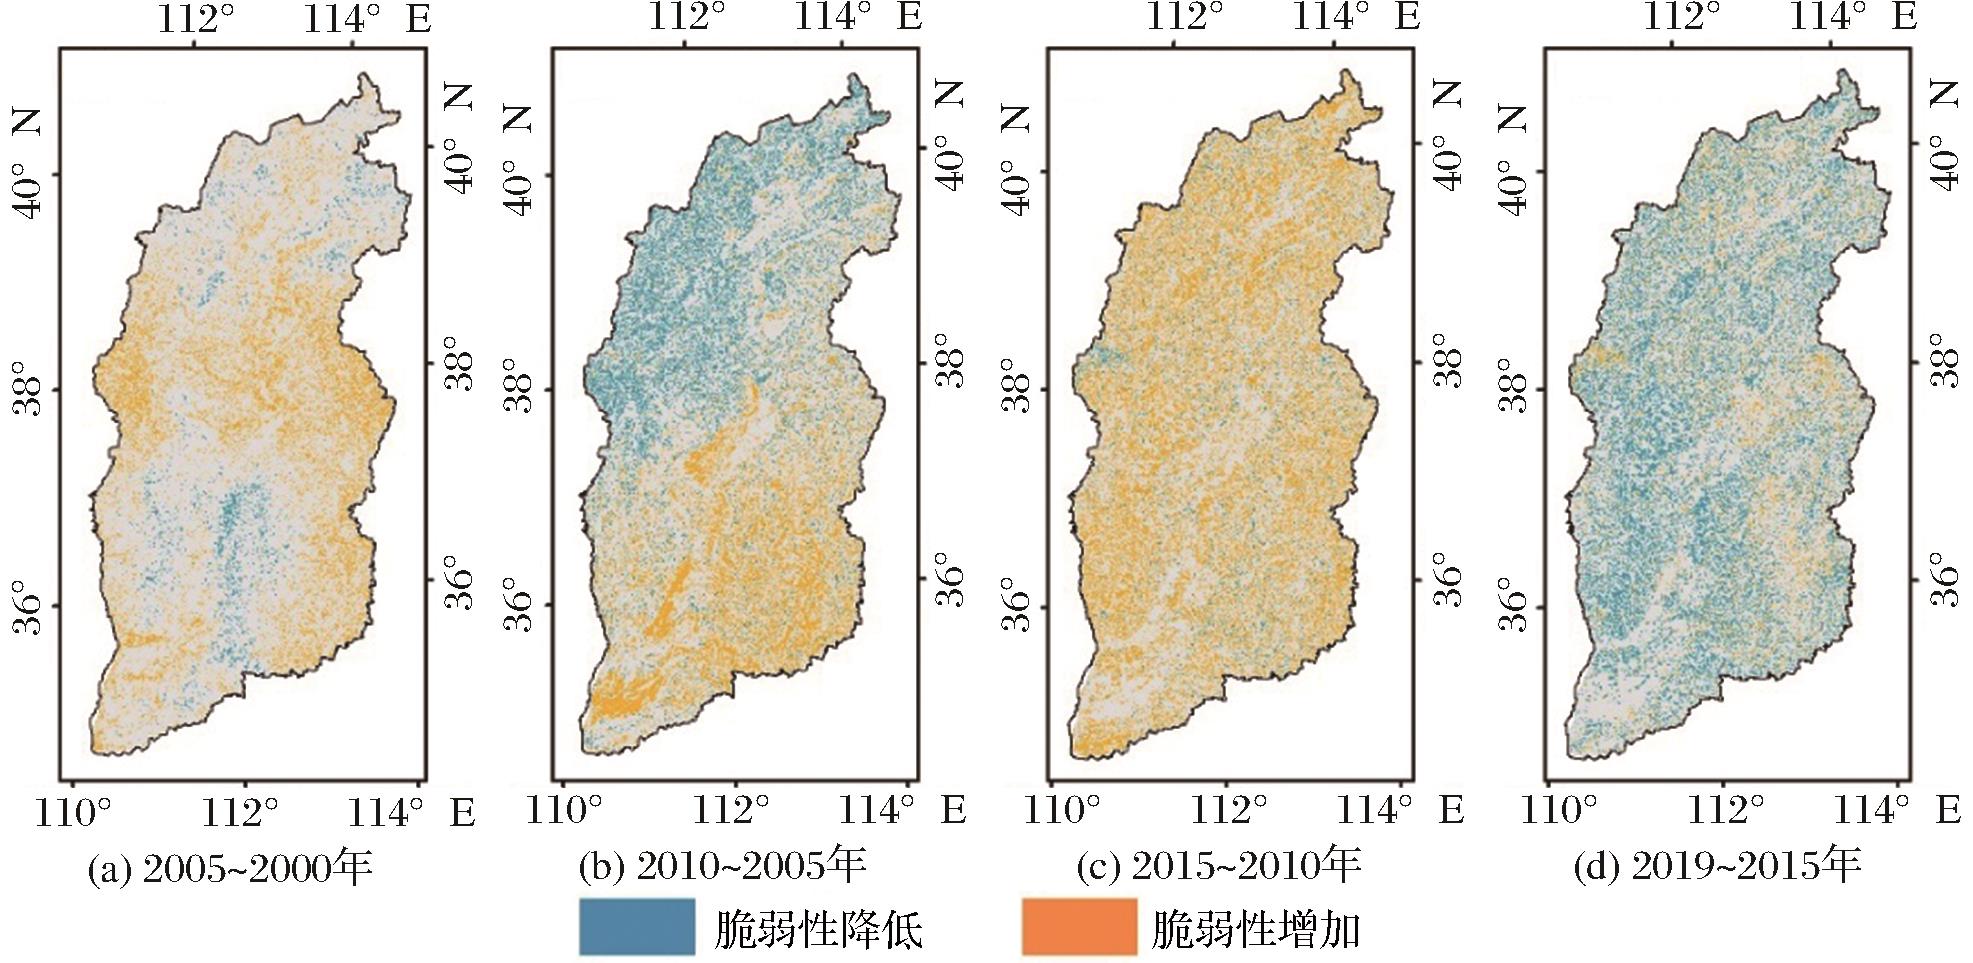
Fig. 3
Spatial distribution from changes of ecological vulnerability of Shanxi Province
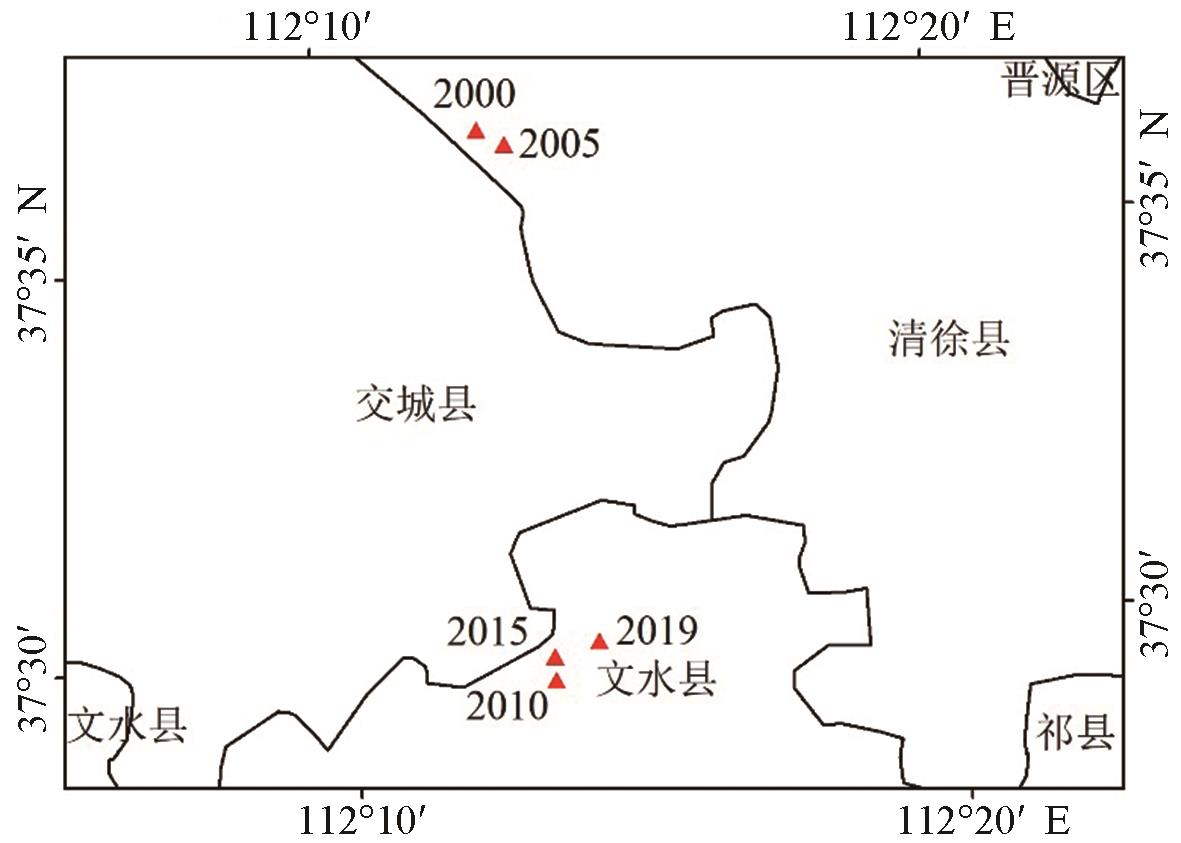
Fig.4
Gravity center migration of ecological vulnerability on Shanxi province from 2000 to 2019
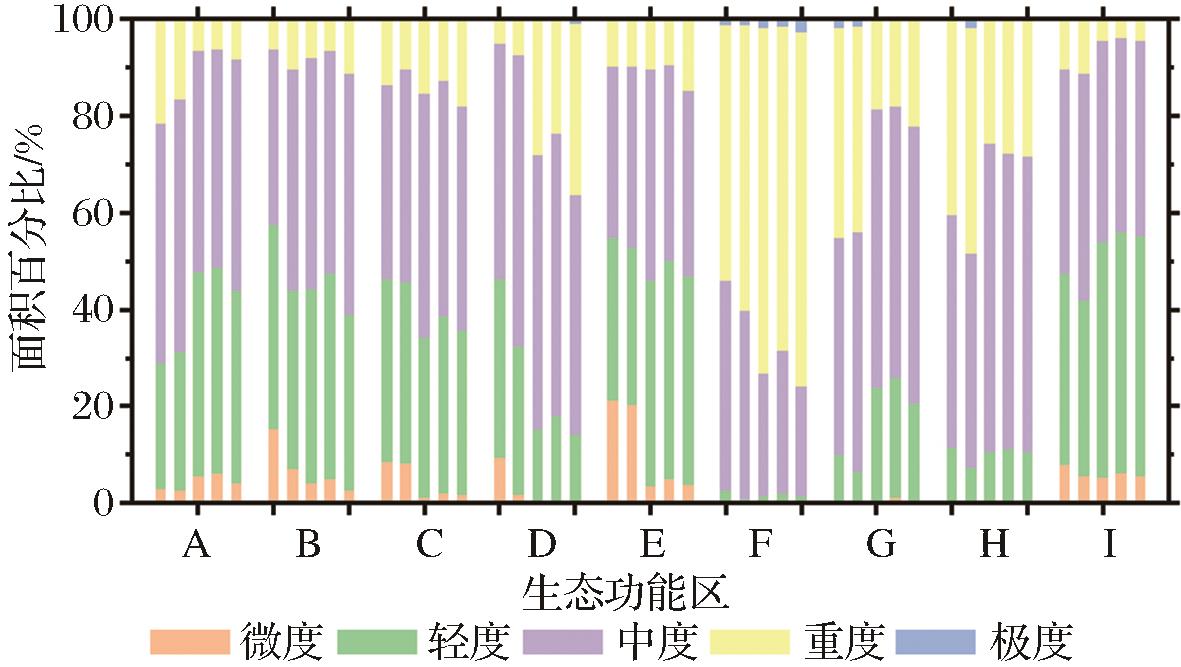
Fig.5
Percentage of ecological vulnerability under different ecological function areas
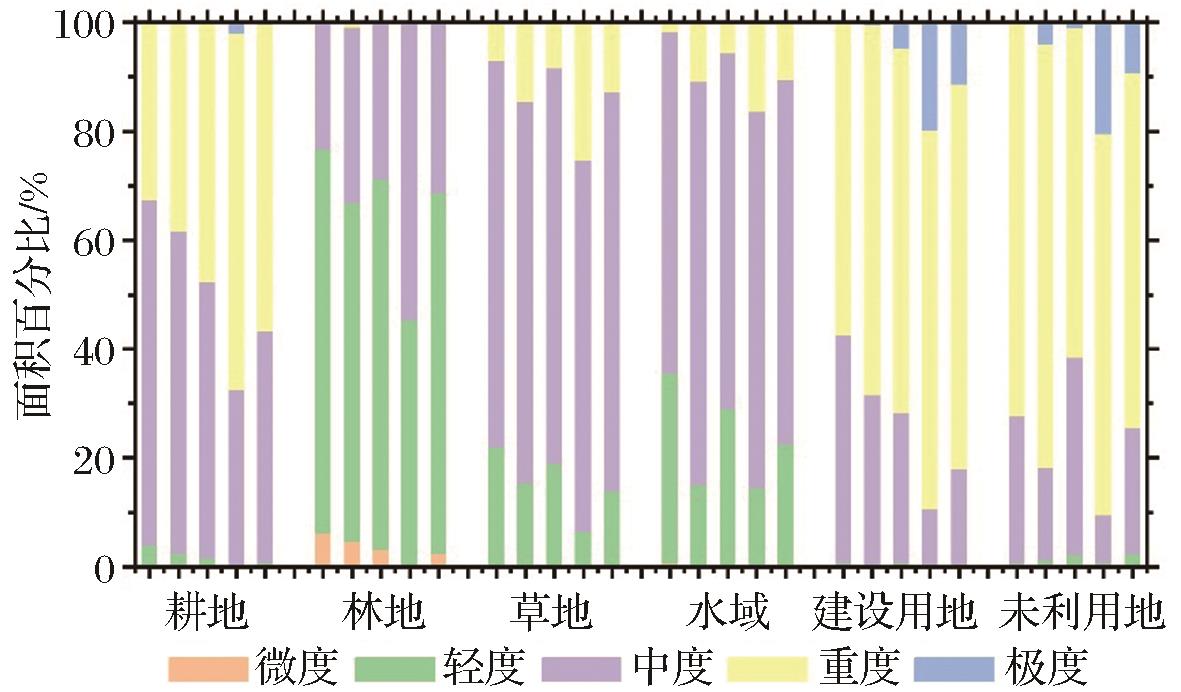
Fig.6
Percentage of ecological vulnerability under different land-use types
Table4
Parameter comparison of OLS and GWR model on different weight kernel function
Table5
Parameter details of GWR (AB) model
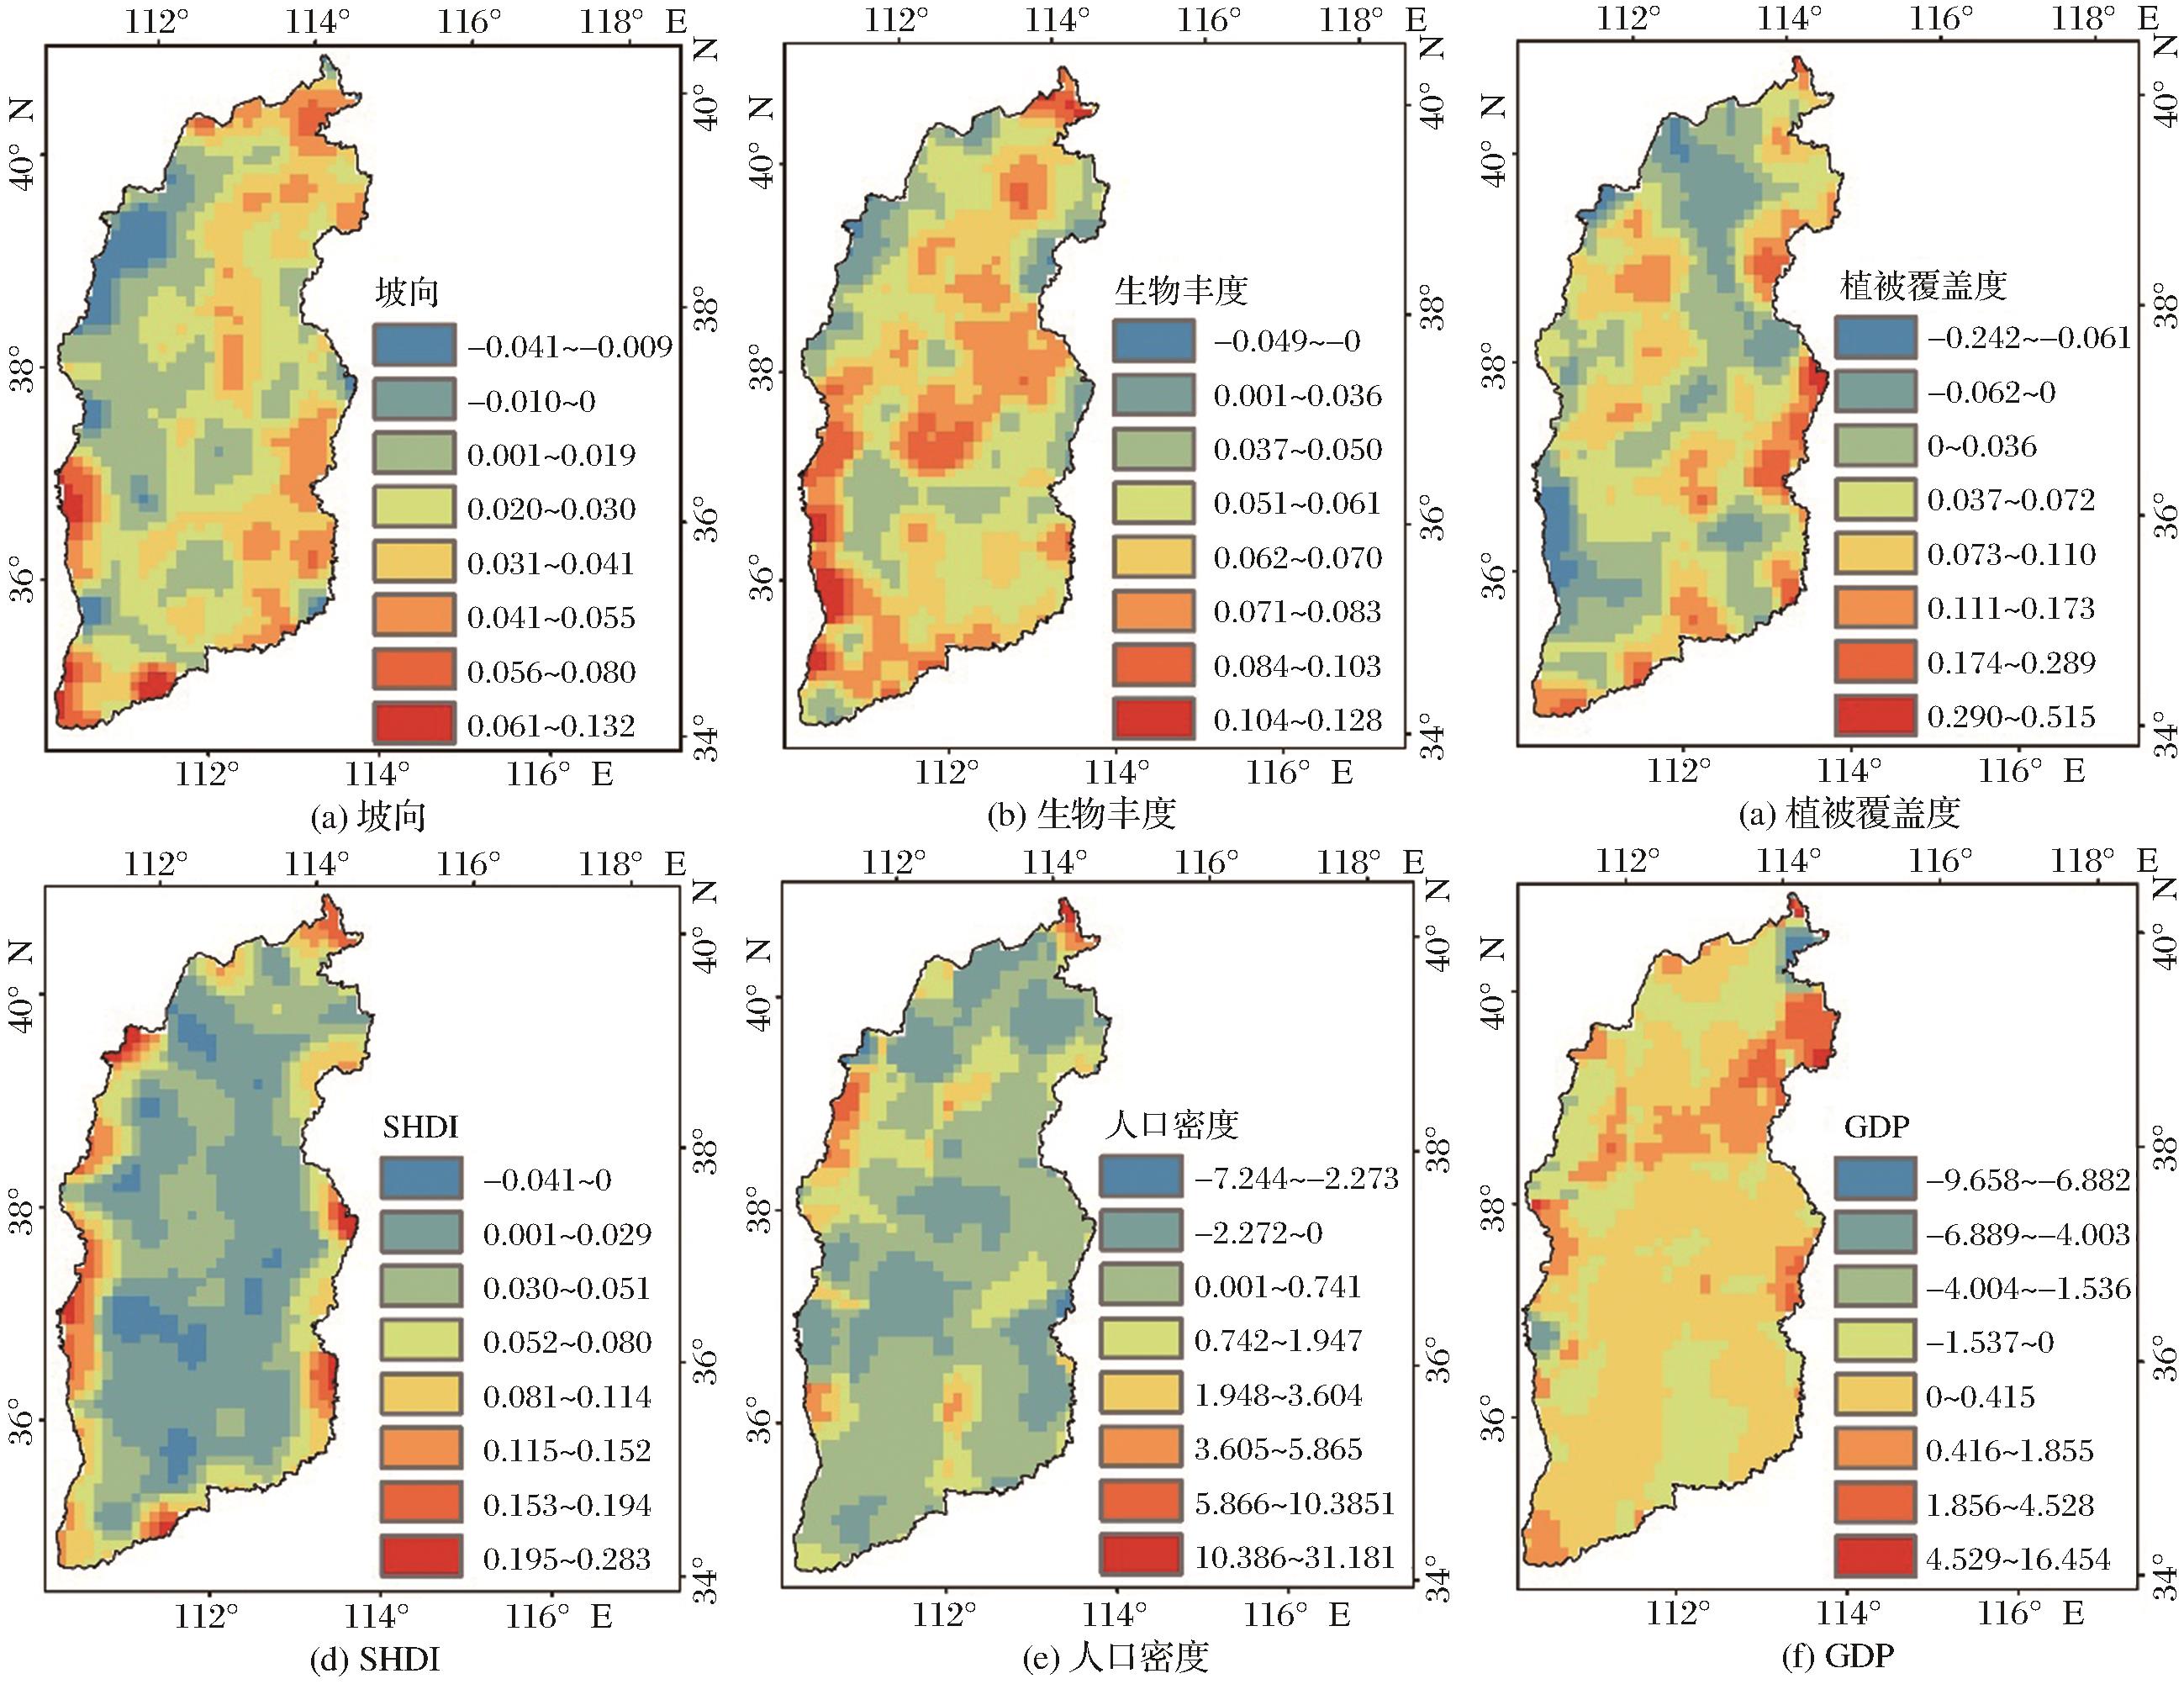
Fig.7
Spatial distribution of coefficients of GWR(AB) model
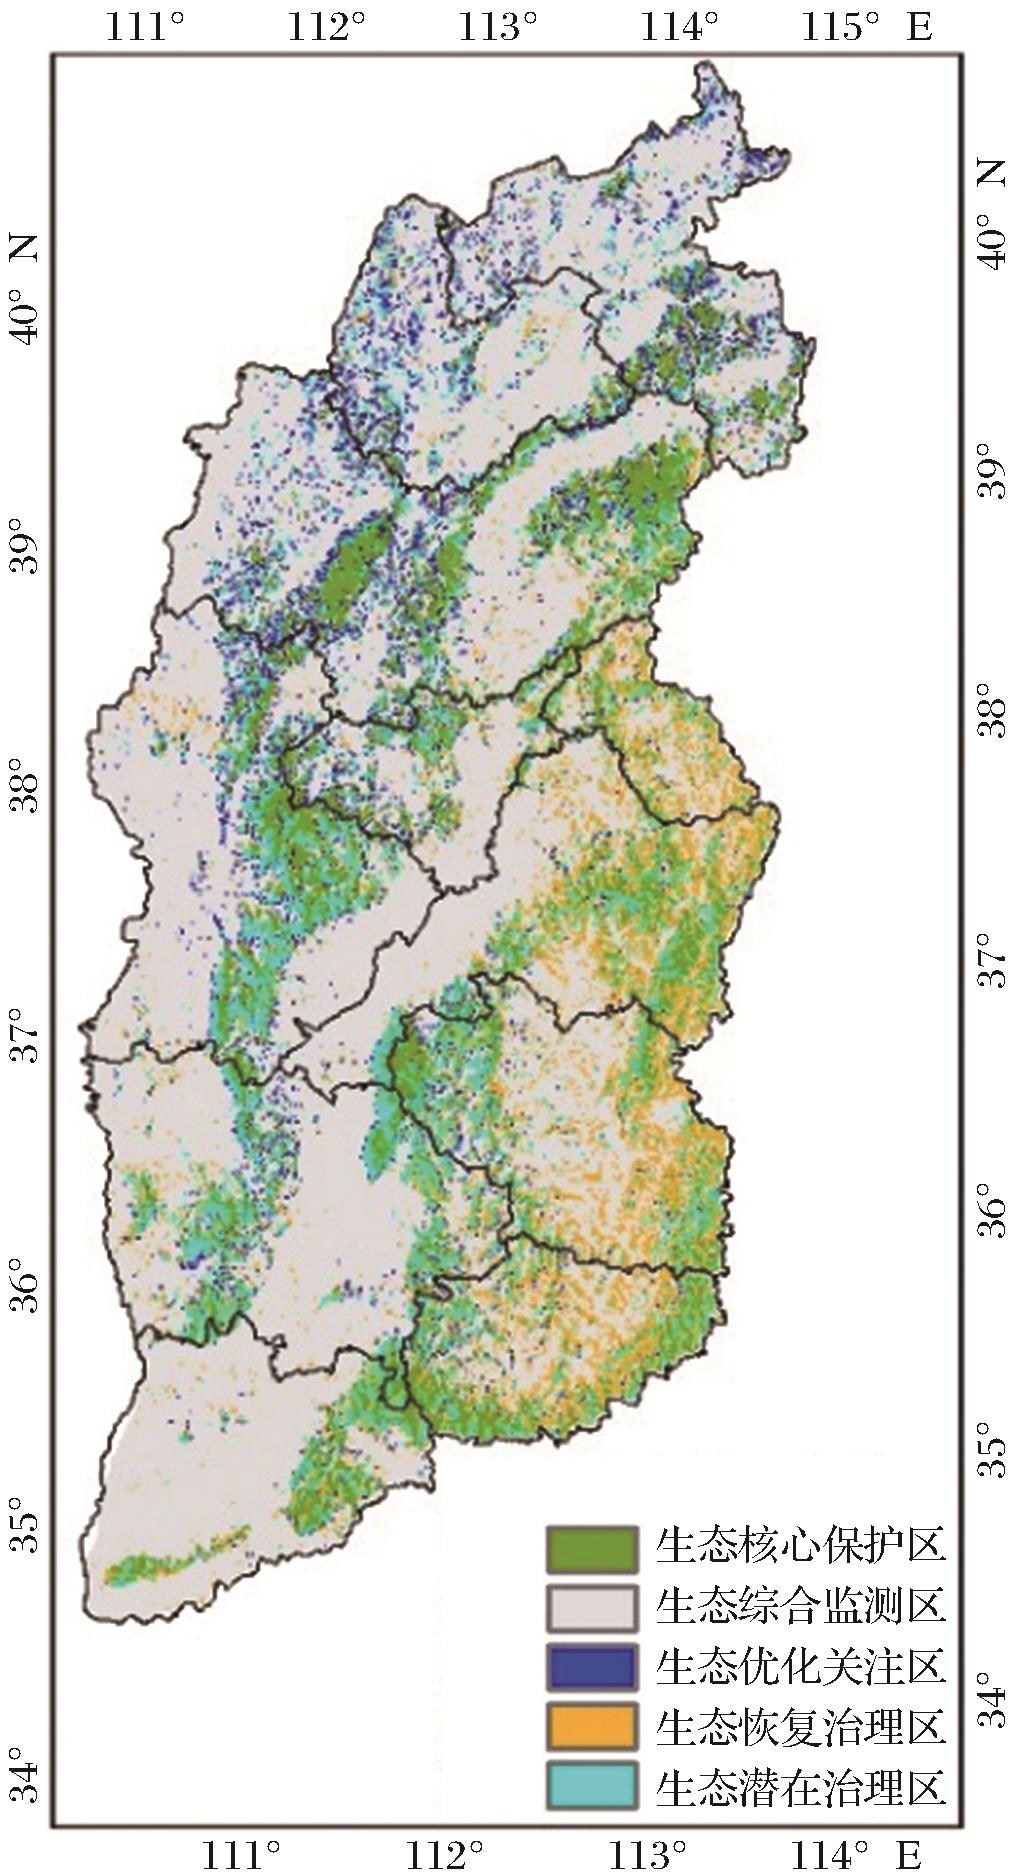
Fig.8
Ecological environment optimization of Shanxi Province
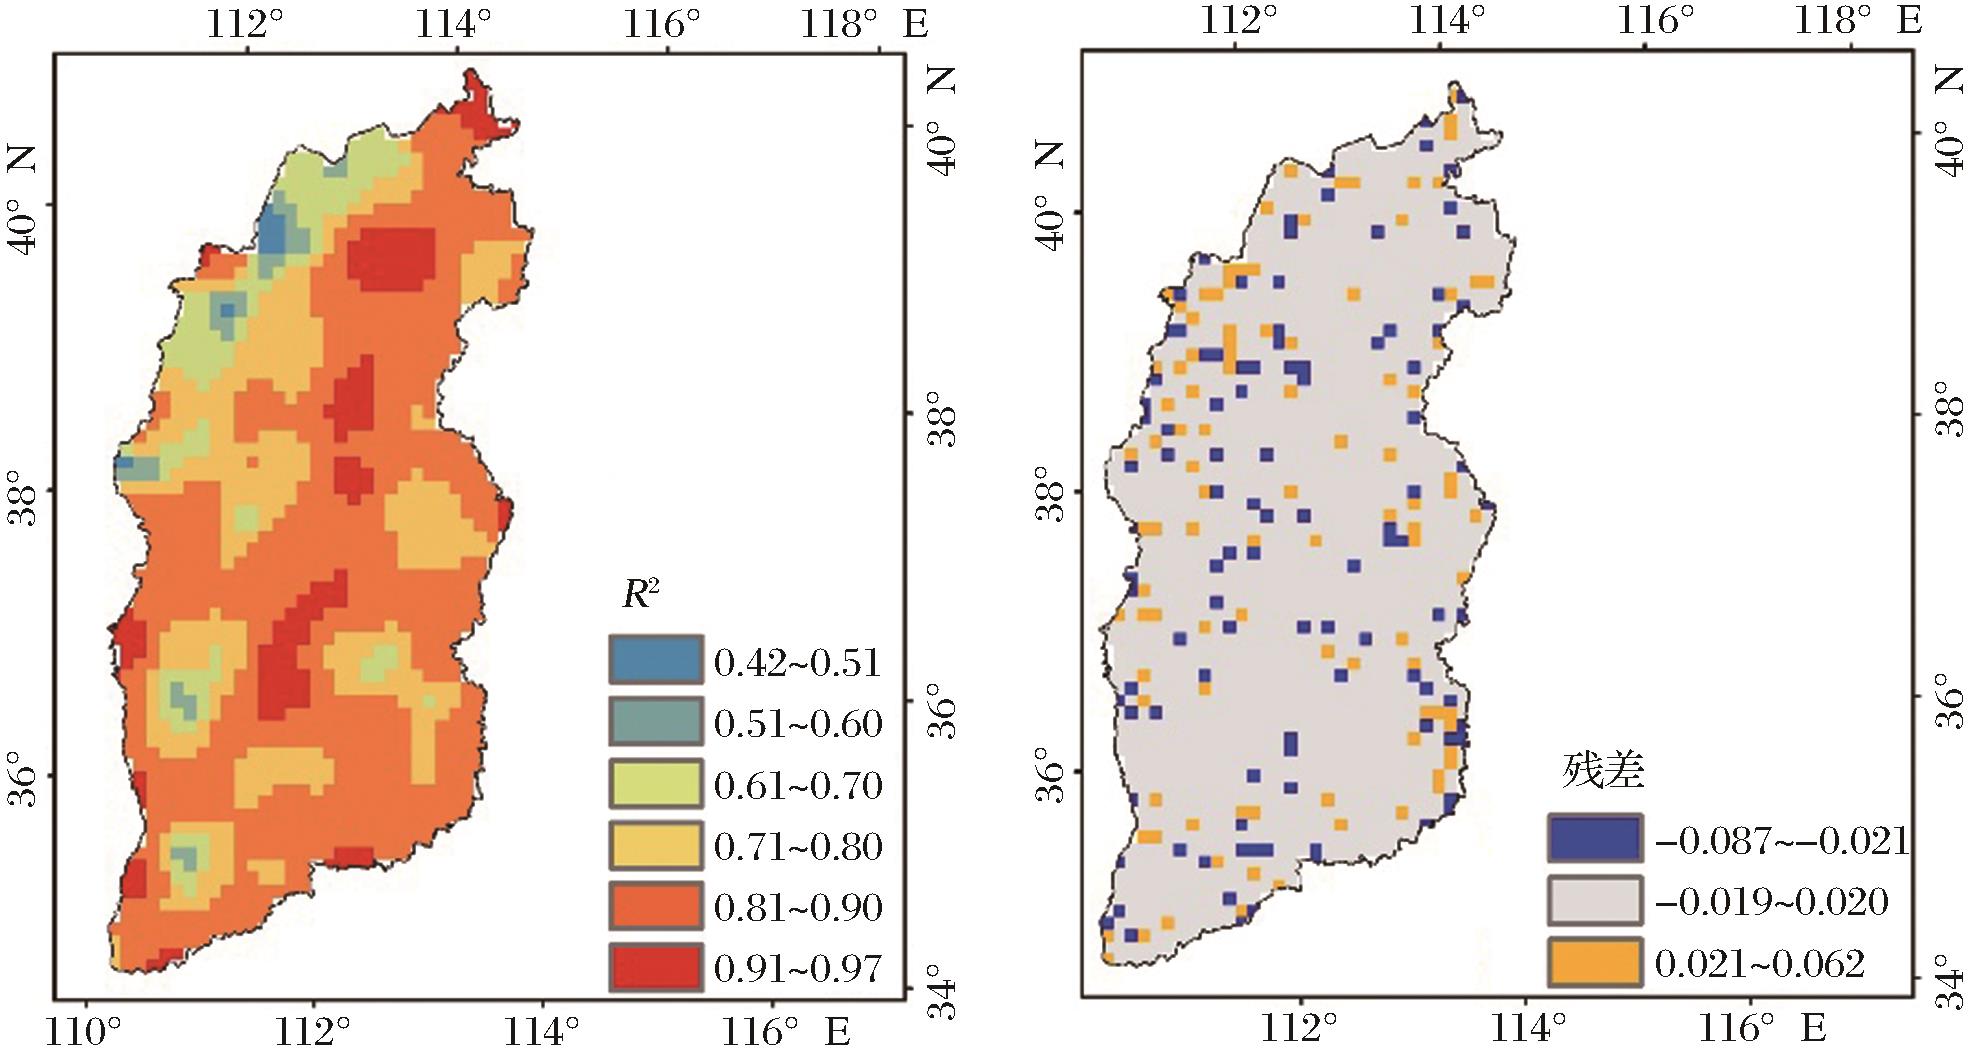
Fig.9
The distribution of
R
2
and residual of GWR(AB) model