Please wait a minute...
img

官方微信

遥感技术与应用  2020, Vol. 35 Issue (4): 845-854    DOI: 10.11873/j.issn.1004-0323.2020.4.0845
甘肃遥感学会专栏     
2015年中国PM2.5浓度遥感估算与时空分布特征
魏石梅(),潘竟虎(),妥文亮
西北师范大学 地理与环境科学学院,甘肃 兰州 730070
Estimation and Spatial-temporal Distribution Characteristics of PM2.5 Concentration by Remote Sensing in China in 2015
Shimei Wei(),Jinghu Pan(),Wenliang Tuo
College of Geography and Environmental Sciences, Northwest Normal University, Lanzhou 730070, China
 全文: PDF(4522 KB)   HTML
摘要:

以PM2.5污染物为主的大气污染对社会的可持续发展及人类健康带来了严峻的挑战,厘清我国PM2.5污染物的空间分布特征及演变规律,对于PM2.5污染物的区域联防联控具有重要的意义。基于MODIS卫星的气溶胶产品、气象基础数据以及PM2.5污染物实测站点监测数据,构建地理加权回归模型,对2015年中国PM2.5污染物浓度进行了模拟估算,对PM2.5污染物浓度的空间分异格局及季节演化特征进行分析。结果表明:①2015年全国PM2.5浓度整体表现出明显的空间地带性分异特征。北方PM2.5污染物浓度明显高于南方,中部明显高于东部与西部;②4个季度PM2.5浓度表现出明显的季节适应性演化特征。第四季度PM2.5污染最重,第三季度和第一季度次之,第二季度最低,最大值出现在第四季度(165 μg/m3),最小值出现在第二季度(4.3 μg/m3)。③通过多因子构建的地理加权回归模型估算的PM2.5浓度具有较高的模拟精度,第一至第四季度的相对误差分别为10.2%、7.0%、9.3%和8.6%。

关键词: PM2.5MODIS遥感估算时空分布中国    
Abstract:

Air pollution characterized by PM2.5 pollutants poses severe challenges to the sustainable development of society and human health. Therefore, it is of great significance to clarify the spatial-temporal distribution and evolution of PM2.5 pollutants in China for regional joint prevention and control of PM2.5 pollutants. Based on the MODIS satellite aerosol products, meteorological basic data and PM2.5 pollutant monitoring site monitoring data, a geographically weighted regression model was established to simulate and estimate PM2.5 pollutant concentration in China in 2015 on the basis of aerosol and meteorological data pre-processing. In addition, the spatial distribution pattern, the seasonal evolution characteristics of PM2.5 pollutant concentration were analyzed. The results showed that: (1) the PM2.5 concentration values in China in 2015 as a whole showed obvious spatial zonal differentiation characteristics. The concentration of pollutants in the north is significantly higher than that in the south, and the areas with high PM2.5 concentrations are mainly concentrated in the Beijing-Tianjin-Hebei region, the Jianghuai plain, the Sichuan basin, and the Takaramalkan desert. The area has a wide spatial distribution and significant continuity; (2) The PM2.5 concentration in the fourth quarter showed obvious seasonal adaptive evolution characteristics. The PM2.5 concentration changed significantly in the season. PM2.5 pollution was the heaviest in the fourth quarter, followed by the first quarter of the third quarter and the lowest in the second quarter. The maximum occurred in the fourth quarter (165 μg/m3). The minimum appeared in the second quarter (4.3 μg/m3). Seasonal changes in PM2.5 concentrations were influenced by meteorological factors and human social activities; and (3) The accuracy of the inversion of PM2.5concentration by a multi-factorial, geographically weighted regression model was higher, with relative errors in the four quarters being 10.2%, 7.0%, 9.3%, and 8.6%, respectively.

Key words: PM2.5    MODIS    Remote sensing estimation    Spatio-temporal distribution    China
收稿日期: 2019-09-03 出版日期: 2020-09-15
ZTFLH:  X513  
基金资助: 国家自然科学基金项目(41661025);西北师范大学青年教师科研能力提升计划(NWNU?LKQN?16?7)
通讯作者: 潘竟虎     E-mail: nwnuweism@126.com;panjh_nwnu@nwnu.edu.cn
作者简介: 魏石梅(1993-),女,宁夏固原人,硕士研究生,主要从事生态环境遥感研究。E?mail:nwnuweism@126.com
服务  
把本文推荐给朋友
加入引用管理器
E-mail Alert
RSS
作者相关文章  
魏石梅
潘竟虎
妥文亮

引用本文:

魏石梅, 潘竟虎, 妥文亮. 2015年中国PM2.5浓度遥感估算与时空分布特征[J]. 遥感技术与应用, 2020, 35(4): 845-854.

Shimei Wei, Jinghu Pan, Wenliang Tuo. Estimation and Spatial-temporal Distribution Characteristics of PM2.5 Concentration by Remote Sensing in China in 2015. Remote Sensing Technology and Application, 2020, 35(4): 845-854.

链接本文:

http://www.rsta.ac.cn/CN/10.11873/j.issn.1004-0323.2020.4.0845        http://www.rsta.ac.cn/CN/Y2020/V35/I4/845

图1  2015年全国PM2.5地面监测站点分布图(审图号:GS(2016)2885)
图2  2015年全国气象监测站点分布图(审图号:GS(2016)2885)
气象因子季度最大值最小值平均数
气压/Pa第一季度10 160.335 728.679 171.40
第二季度10 077.675 728.679 120.07
第三季度10 206.335 756.339 211.47
第四季度10 299.335 655.469 244.34
风速/m·s-1第一季度97.677.6724.85
第二季度96.004.9221.34
第三季度79.674.3320.13
第四季度10 956.334.6734.49
相对湿度/%第一季度93.6716.0060.06
第二季度93.6726.0069.41
第三季度94.0020.0070.49
第四季度87.0012.0064.69
降水量/mm第一季度4 401.670.00726.11
第二季度5 949.6724.001 348.79
第三季度10 960.330.00709.90
第四季度2 303.000.00356.78
表1  各季度气象数据描述性统计结果
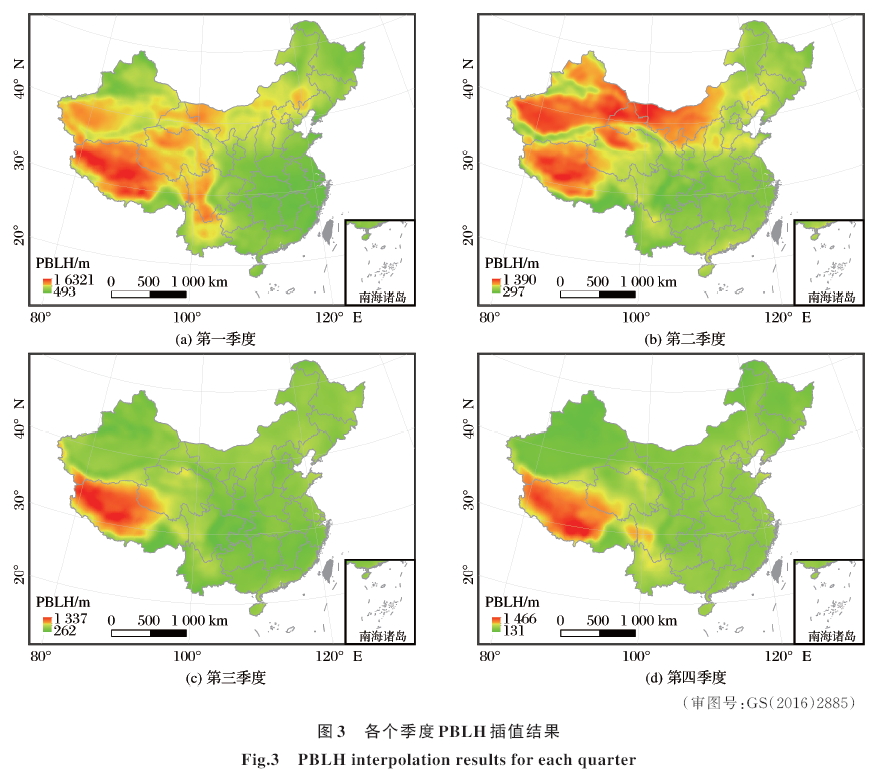
图3  各个季度PBLH插值结果(审图号:GS(2016)2885)
第一季度第二季度第三季度第四季度
决定系数(R20.530.560.580.54
相对误差10.2%7.0%9.3%8.6%
表2  模型检验统计结果
图4  2015年PM2.5空间分布(审图号:GS(2016)2885)
图5  2015年各个季度PM2.5空间分布(审图号:GS(2016)2885)
1 Song Ting, Liu Junzhi, Hu Tingting, et al. Application of Atmospheric Particles Monitoring based on MODIS Aerosol Optical Thickness Products and Laser Radar[J]. Remote Sensing Technology and Application, 2016, 31(2):397-404.
1 宋挺, 刘军志, 胡婷婷, 等. MODIS气溶胶光学厚度产品和激光雷达数据在大气颗粒物监测中的应用[J]. 遥感技术与应用, 2016, 31(2):397-404.
2 Matus K, Nam K M, Selin N E, et al. Health Damages from Air Pollution in China[J]. Global Environmental Change, 2012, 22(1):55-66.
3 Crane K, Mao Z M. Costs of Selected Policies to Address Air Pollution in China[M]. Santa Monica, CA: RAND Corporation, 2015.
4 Heck T, Hirschberg S. China: Economic Impacts of Air Pollution in the Country[J]. Encyclopedia of Environmental Health, 2011:625-640. doi: 10.1016/B978-0-444-52272-6.00415-3.
doi: 10.1016/B978-0-444-52272-6.00415-3
5 He Aihong, Xin Zhao, Liu Shu, et al. Spatial and Temporal Distribution of PM2.5 in Pingxiang City[J]. Journal of Pingxiang University, 2018, 35(6):49-52.
5 何爱红, 辛朝, 刘澍, 等. 萍乡市大气污染PM2.5时空分布规律[J]. 萍乡学院学报, 2018, 35(6):49-52.
6 Nuno R M, Guilherme C D G. Impact of PM2.5 in Indoor Urban Environments: A Review[J]. Sustainable Cities and Society, 2018,42:259-275. doi:10.1016/j.SCS.2018.07.011.
doi: 10.1016/j.SCS.2018.07.011
7 Du Zhenhong, Wu Sensen, Wang Zhongyi, et al. Estimating Ground-level PM2.5 Concentrations Across China Using Geographically Neural Network Weighted Regression[J]. Journal of Geo-information Science, 2020, 22(1):122-135.
7 杜震洪, 吴森森, 王中一, 等. 基于地理神经网络加权回归的中国PM2.5浓度空间分布估算方法[J].地球信息科学学报, 2020, 22(1):122-135.
8 Yang Kun, Yang Yulian, Zhu Yanhui, et al. Social and Economic Drivers of PM2.5 and Their Spatial Relationship in China[J]. Geographical Research, 2016, 35(6):1051-1060.
8 杨昆, 杨玉莲, 朱彦辉, 等. 中国PM2.5污染与社会经济的空间关系及成因[J]. 地理研究, 2016, 35(6):1051-1060.
9 Teng Enjiang, Hu Wei, Wu Guoping, et al. The Composing Characteristics of Elements in Coarse and Fine Particle in Air of the Four Cities in China[J]. China Environment Science, 1999, 19(3):238-242.
9 滕恩江, 胡伟, 吴国平, 等. 中国四城市空气中粗细颗粒物元素组成特征[J]. 中国环境科学, 1999, 19(3):238-242.
10 Liang F C,Xiao Q Y,Wang Y J, et al. MAIAC-based Long-term Spatiotemporal Trends of PM2.5 in Beijing,China[J]. Science of the Total Environment, 2017, 616-617:1589-1598.
11 Wang Zhenbo, Fang Chuanglin, Xu Guang, et al. Spatial-temporal Characteristics of the PM2.5 in China in 2014[J]. Acta Geographica Sinica, 2015, 70(11):1720-1734.
11 王振波, 方创琳, 许光, 等. 2014年中国城市PM2.5浓度的时空变化规律[J]. 地理学报, 2015, 70(11):1720-1734.
12 Xu Jianhui, Jiang Hong. Estimation of PM2.5 Concentration over the Yangtze Delta Using Remote Sensing: Analysis of Spatial and Temporal Variations[J]. Environmental Science, 2015, 36(9):3119-3127.
12 徐建辉, 江洪. 长江三角洲PM2.5质量浓度遥感估算与时空分布特征[J]. 环境科学, 2015, 36(9):3119-3127.
13 Chelani A B. Estimating PM2.5 Concentration from Satellite Derived Aerosol Optical Depth and Meteorological Variables Using A Combination Model[J]. Atmospheric Pollution Research, 2019, 10(3):847-857.
14 Kang Hongxia, Na Xiaodong, Zang Shuying. Advance in Ground-level PM2.5 Prediction Using Remote Sensing Data (AOD)[J]. Environment Science and Management, 2016, 41(2):30-34.
14 亢红霞, 那晓东, 臧淑英. 基于卫星遥感数据(AOD)估算PM2.5的研究进展[J]. 环境科学与管理, 2016, 41(2):30-34.
15 Chen Meijuan, Liu Jing, Liu Limin, et al. Inversion of PM2.5 with MODIS Data in Shenyang[J]. Environmental Science & Technology, 2016,39(12):87-93.
15 陈美娟, 刘静, 刘利民, 等. 基于MODIS数据的沈阳市PM2.5反演研究[J]. 环境科学与技术, 2016, 39(12):87-93.
16 Xia Zhiye, Liu Zhihong, Wang Yongqian, et al. Research on Ground-Level PM2.5 Mass Concentration Retrieval based on MODIS Aerosol Optical Thickness[J]. Plateau Meteorology, 2015, 34(6):1765-1771.
16 夏志业, 刘志红, 王永前, 等. MODIS气溶胶光学厚度的PM2.5质量浓度遥感反演研究[J]. 高原气象, 2015, 34(6):1765-1771.
17 Remer L A, Kaufman Y J, Tanré D, et al. The MODIS Aerosol Algorithm, Products, and Validation[J]. Journal of the Atmospheric Sciences, 2005, 62(4):947–973.
18 Yuan Xingming, Xing Lipeng, Jin Hebo, et al. Estimation of PM2.5 over Shandong from MODIS AOD[J]. Geomatics & Spatial Information Technology, 2018, 41(11):88-90, 93.
18 袁兴明, 邢立鹏, 靳合波, 等. 基于MODIS AOD的山东地区PM2.5反演[J]. 测绘与空间地理信息, 2018, 41(11):88-90, 93.
19 Ma Z W, Hu X F, Huang L, et al. Estimating Ground-level PM2.5 in China Using Satellite Remote Sensing[J]. Environmental Science & Technology, 2014, 48(13):7436-7444.
20 Guo Jianping, Wu Yerong, Zhang Xiaoye, et al. Estimation of PM2.5 over Eastern China from MODIS Aerosol Optical Depth Using the Back Propagation Neural Network[J]. Environmental Science, 2013, 34(3):817-825.
20 郭建平, 吴业荣, 张小曳, 等. BP网络框架下MODIS气溶胶光学厚度产品估算中国东部PM2.5[J]. 环境科学, 2013, 34(3):817-825.
21 Liu Guangmeng, Wang Yunjia, Zhang Hairong, et al. Comparative Study of Several Interpolation Methods on Spatial Analysis[J]. Geomatics World, 2011, 9(3):41-45.
21 刘光孟, 汪云甲, 张海荣, 等. 空间分析中几种插值方法的比较研究[J]. 地理信息世界, 2011, 9(3):41-45.
22 Zhang Tianqi. Evaluation of the Aerosol Optical Depth Production and Retrieval of the PM2.5 in China Using MODIS Images[D]. Chengdu: Southwest Jiaotong University. 2017.张天棋. 基于MODIS影像的中国地区气溶胶产品验证与PM2.5反演[D]. 成都: 西南交通大学, 2017.
23 Wang Zebin, Zou Bin, Qiu Yonghong, et al. Geographical Characterization of Relationship between Aerosol Optical Depth and PM2.5in China[J]. Remote Sensing Information, 2016, 31(6):26-35.
23 王泽斌, 邹滨, 邱永红, 等. 中国气溶胶光学厚度与PM2.5时空关联的地理学特征[J].遥感信息, 2016, 31(6):26-35.
24 Zhang Lianglin, Pan Jinghu, Lai Jianbo, et al. Estimation of PM2.5 Mass Concentrations in Beijing-Tianjin-Hebei Region based on Geographically Weighted Regression and Spatial Downscaling Method[J]. Acta Scientiae Circumstantiae, 2019, 39(3):832-842.
24 张亮林, 潘竟虎, 赖建波, 等. 基于GWR降尺度的京津冀地区PM2.5质量浓度空间分布估算[J]. 环境科学学报, 2019, 39(3):832-842.
25 Chen Hui, Li Qing, Zhang Yuhuan, et al. Estimations of PM2.5 Concentrations based on the Method of Geographically Weighted Regression[J]. Acta Scientiae Circumstantiae, 2016, 36(6):2142-2151.
25 陈辉, 厉青, 张玉环, 等. 基于地理加权模型的我国冬季PM2.5遥感估算方法研究[J]. 环境科学学报, 2016, 36(6):2142-2151.
26 Duan Jiexiong, Zhai Weixin, Cheng Chengqi, et al. Socio-economic Factors Influencing the Spatial Distribution of PM2.5 Concentrations in China: An Exploratory Analysis[J]. Environmental Science, 2018, 39(5):2498-2504.
26 段杰雄, 翟卫欣, 程承旗, 等. 中国PM2.5污染空间分布的社会经济影响因素分析[J]. 环境科学, 2018, 39(5):2498-2504.
27 Wang J, Christopher S A. Intercomparison between Satellite-derived Aerosol Optical Thickness and PM2.5 Mass: Implications for Air Quality Studies[J]. Geophysical Research Letters, 2003, 30(21):1-14.
28 Dong Jiadan, Chen Xiaolin, Sun Kun, et al. Comparative Analysis of Three Models for Monitoring PM2.5 in Hubei Province Using MODIS Data[J]. Science of Surveying and Mapping, 2019,44(10):35-42.
28 董佳丹, 陈晓玲, 孙昆, 等. 利用MODIS资料监测湖北省PM2.5的3种模型对比[J].测绘科学, 2019,44(10):35-42.
29 Hajiloo F, Hamzeh S, Gheysari M. Impact Assessment of Meteorological and Environmental Parameters on PM2.5 Concentrations Using Remote Sensing Data and GWR Analysis (Case Study of Tehran)[J]. Environmental Science and Pollution Research, 2018, 26:24331-24345.
30 Liu Chong, Zhao Tianliang, Xiong Jie, et al. A Simulated Climatology of Dust Aerosol Eissions over 1991~2010 and the Influencing Factors of Atmospheric over the Major Deserts in the world[J]. Journal of Desert Research, 2015, 35(4):959-970.
30 刘冲, 赵天良, 熊洁, 等. 1991~2010年全球沙尘气溶胶排放量气候特征及其大气环流影响因子[J]. 中国沙漠, 2015, 35(4):959-970.
31 Chen G B, Li S S, Knibbs L D, et al. A Machine Learning Method to Estimate PM2.5, Concentrations Across China with Remote Sensing, Meteorological and Land Use Information[J]. Science of The Total Environment, 2018, 636:52-60.
32 Fan Jiao, Guo Baofeng, He Hongchang. Retrieval of Aerosol Optical Thickness with MODIS Data over Hangzhou[J]. Acta Optica Sinica, 2015, 35(1):1-9.
32 范娇, 郭宝峰, 何宏昌. 基于MODIS数据的杭州地区气溶胶光学厚度反演[J]. 光学学报, 2015, 35(1):1-9.
33 Yang Wentao, Huang Huikun, Wei Dongsheng, et al. Spatio-temporal Variation of PM2.5 Related Relationships in China from the Perspective of Air Pollution Regional Linkage Control and Prevention[J]. Environmental Science, 2020, 41(5):2066-2074.
33 杨文涛, 黄慧坤, 魏东升, 等. 大气污染联合治理分区视角下的中国PM2.5关联关系时空变异特征分析[J]. 环境科学, 2020, 41(5):2066-2074.
[1] 韦海宁,王维真,黄广辉,徐菲楠,冯姣姣,董磊磊. 基于Himawari-8的气溶胶反演研究[J]. 遥感技术与应用, 2020, 35(4): 797-807.
[2] 李超,李雪梅,田亚林,任瑞. 温度植被干旱指数时空融合模型对比[J]. 遥感技术与应用, 2020, 35(4): 832-844.
[3] 董超,赵庚星. 时序数据集构建质量对土地覆盖分类精度的影响研究[J]. 遥感技术与应用, 2020, 35(3): 558-566.
[4] 马延吉,王宗明,王江浩,左小安,段洪涛,刘阁,任嘉敏. 典型区“美丽中国”全景评价指标体系构建思路[J]. 遥感技术与应用, 2020, 35(2): 287-294.
[5] 沈明,丁云生,段洪涛. 基于地球大数据的“美丽湖泊” SDG 6.3.2综合评价体系构建[J]. 遥感技术与应用, 2020, 35(2): 295-301.
[6] 龙爽,郭正飞,徐粒,周华真,方伟华,许映军. 基于Google Earth Engine的中国植被覆盖度时空变化特征分析[J]. 遥感技术与应用, 2020, 35(2): 326-334.
[7] 郑贵洲,熊良超,廖艳雯,王红平. 利用MODIS数据反演南海南部海表温度及时空变化分析[J]. 遥感技术与应用, 2020, 35(1): 132-140.
[8] 赵春亮,许文波,范锦龙. FY-3C中分辨率成像光谱仪数据的窄波段地表反照率验证研究[J]. 遥感技术与应用, 2020, 35(1): 153-162.
[9] 王一帆,徐涵秋. 利用MODIS EVI时间序列数据分析福建省植被变化(2000~2017年)[J]. 遥感技术与应用, 2020, 35(1): 245-254.
[10] 徐卫星,薛华柱,靳华安,李爱农. 融合遥感先验信息的叶面积指数反演[J]. 遥感技术与应用, 2019, 34(6): 1235-1244.
[11] 肖林,车涛,戴礼云. 多源雪深数据在中国的空间特征评估[J]. 遥感技术与应用, 2019, 34(6): 1133-1145.
[12] 冯艾琳,武晋雯,孟莹,姜鹏,董巍,张璇,方缘,刘斌. 基于MODIS GPP数据产品的辽宁省碳源/汇空间格局分布研究[J]. 遥感技术与应用, 2019, 34(4): 857-864.
[13] 冯婵莹, 汪子豪, 郑成洋. 基于分层线性回归的MODIS反照率产品降尺度方法研究[J]. 遥感技术与应用, 2019, 34(3): 602-611.
[14] 王莹莹, 袁金国, 张莹, 吴朝阳. 中国温带地区植被物候期时空变化特征及对总初级生产力的影响[J]. 遥感技术与应用, 2019, 34(2): 377-388.
[15] 殷宇威, 唐丹玲, 刘宇鹏. 南海岛礁附近悬浮泥沙时空分布的遥感研究[J]. 遥感技术与应用, 2019, 34(2): 435-444.