×
模态框(Modal)标题
在这里添加一些文本
Close
Close
Submit
Cancel
Confirm
×
模态框(Modal)标题
×
ISSN 1004-0323
CN 62-1099/TP
RSS
|
Email Alert
Toggle navigation
Home
About Journal
Editorial Board
Instruction
Journal Online
Current Issue
Online First
Archive
Most Read
Most Download
Most Cited
Subscription
Advertisement
Publication Ethics
Contact Us
中文
Figure/Table detail
Spatial and Temporal Change Pattern and Trend Prediction of Land Use in the Middle Reaches of the Yellow River
Ziyi WANG, Min HONG, Xiaofeng LIU
Remote Sensing Technology and Application
, 2025, 40(
3
): 748-760. DOI:
10.11873/j.issn.1004-0323.2025.3.0748
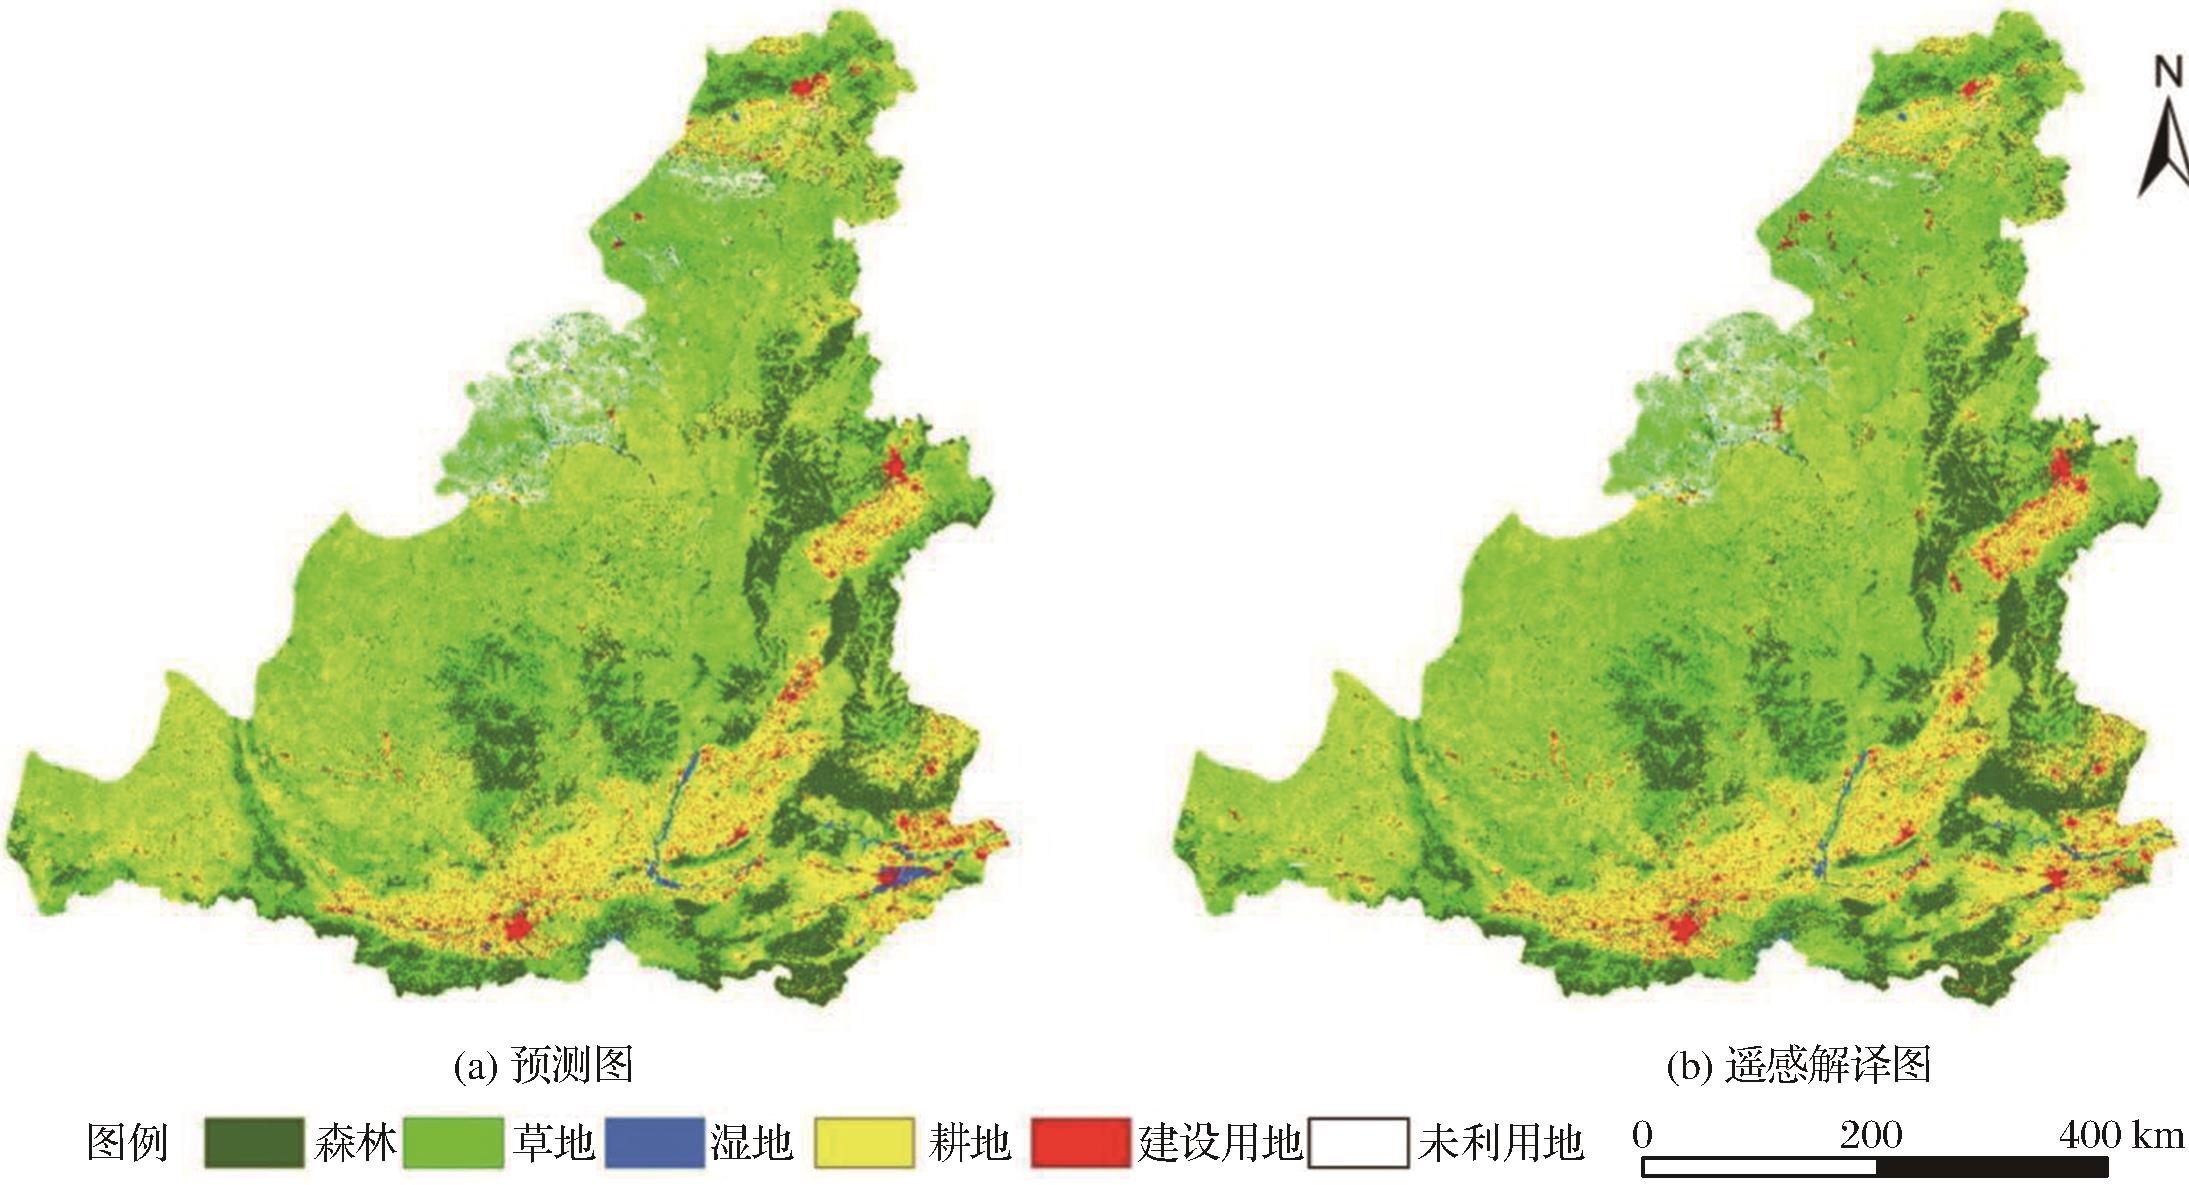
Fig.2
Comparison of 2015 LULC Remote Sensing Interpretation and Prediction Map
Other figure/table from this article
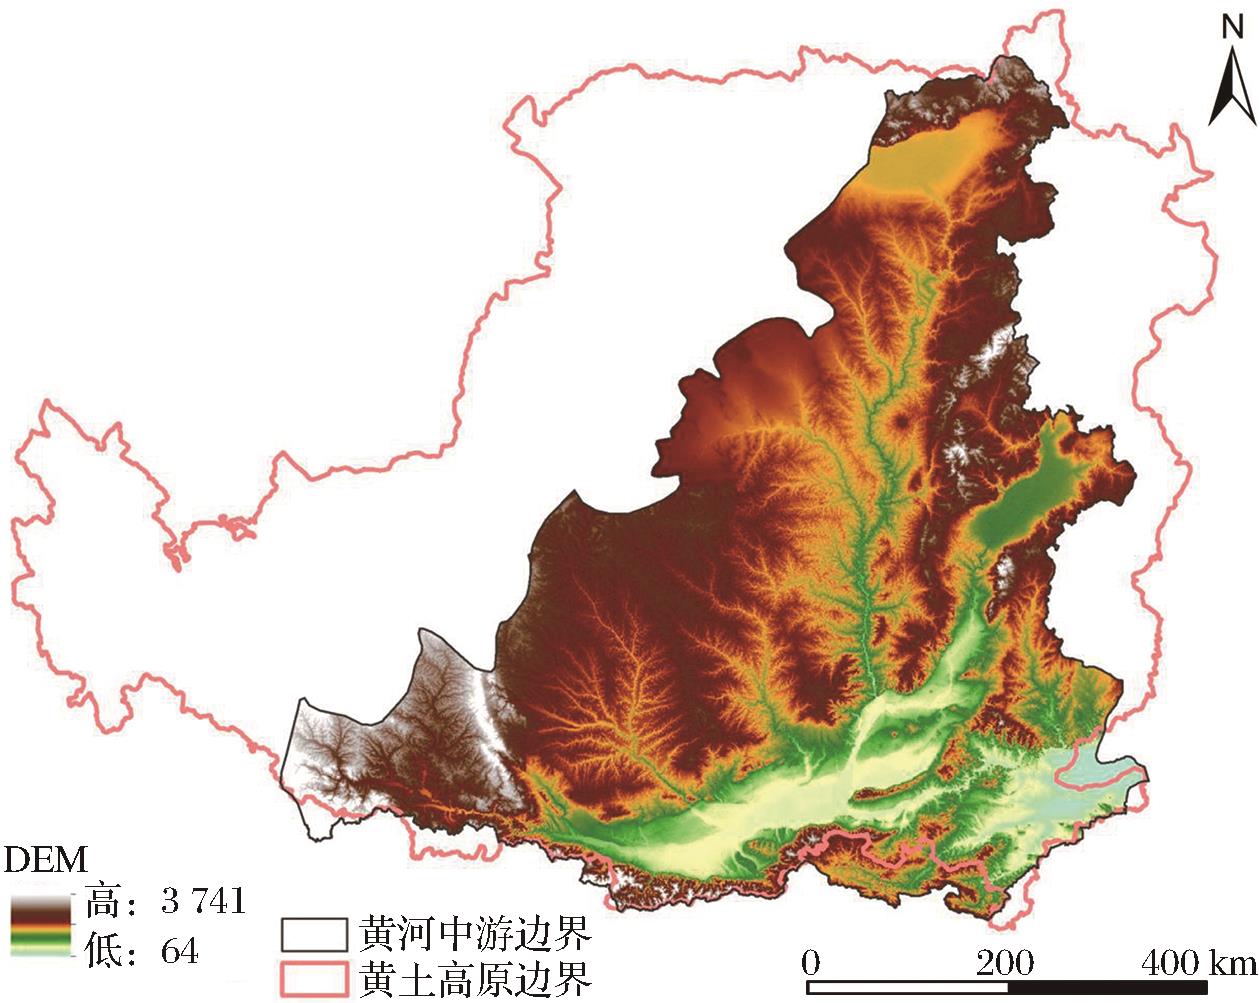
Fig.1
Geographical location of the middle reaches of the Yellow River
Table 1
Part of Image Acquisition Time and Row Number
Table 2
Land use and land cover categories and their descriptions
Table 3
Driving Factors and Explanation of Land Use Factor Changes in the Middle Reaches of the Yellow River
Table 4
Translation Characteristics Table of Land Use in the Middle Reaches of the Yellow River
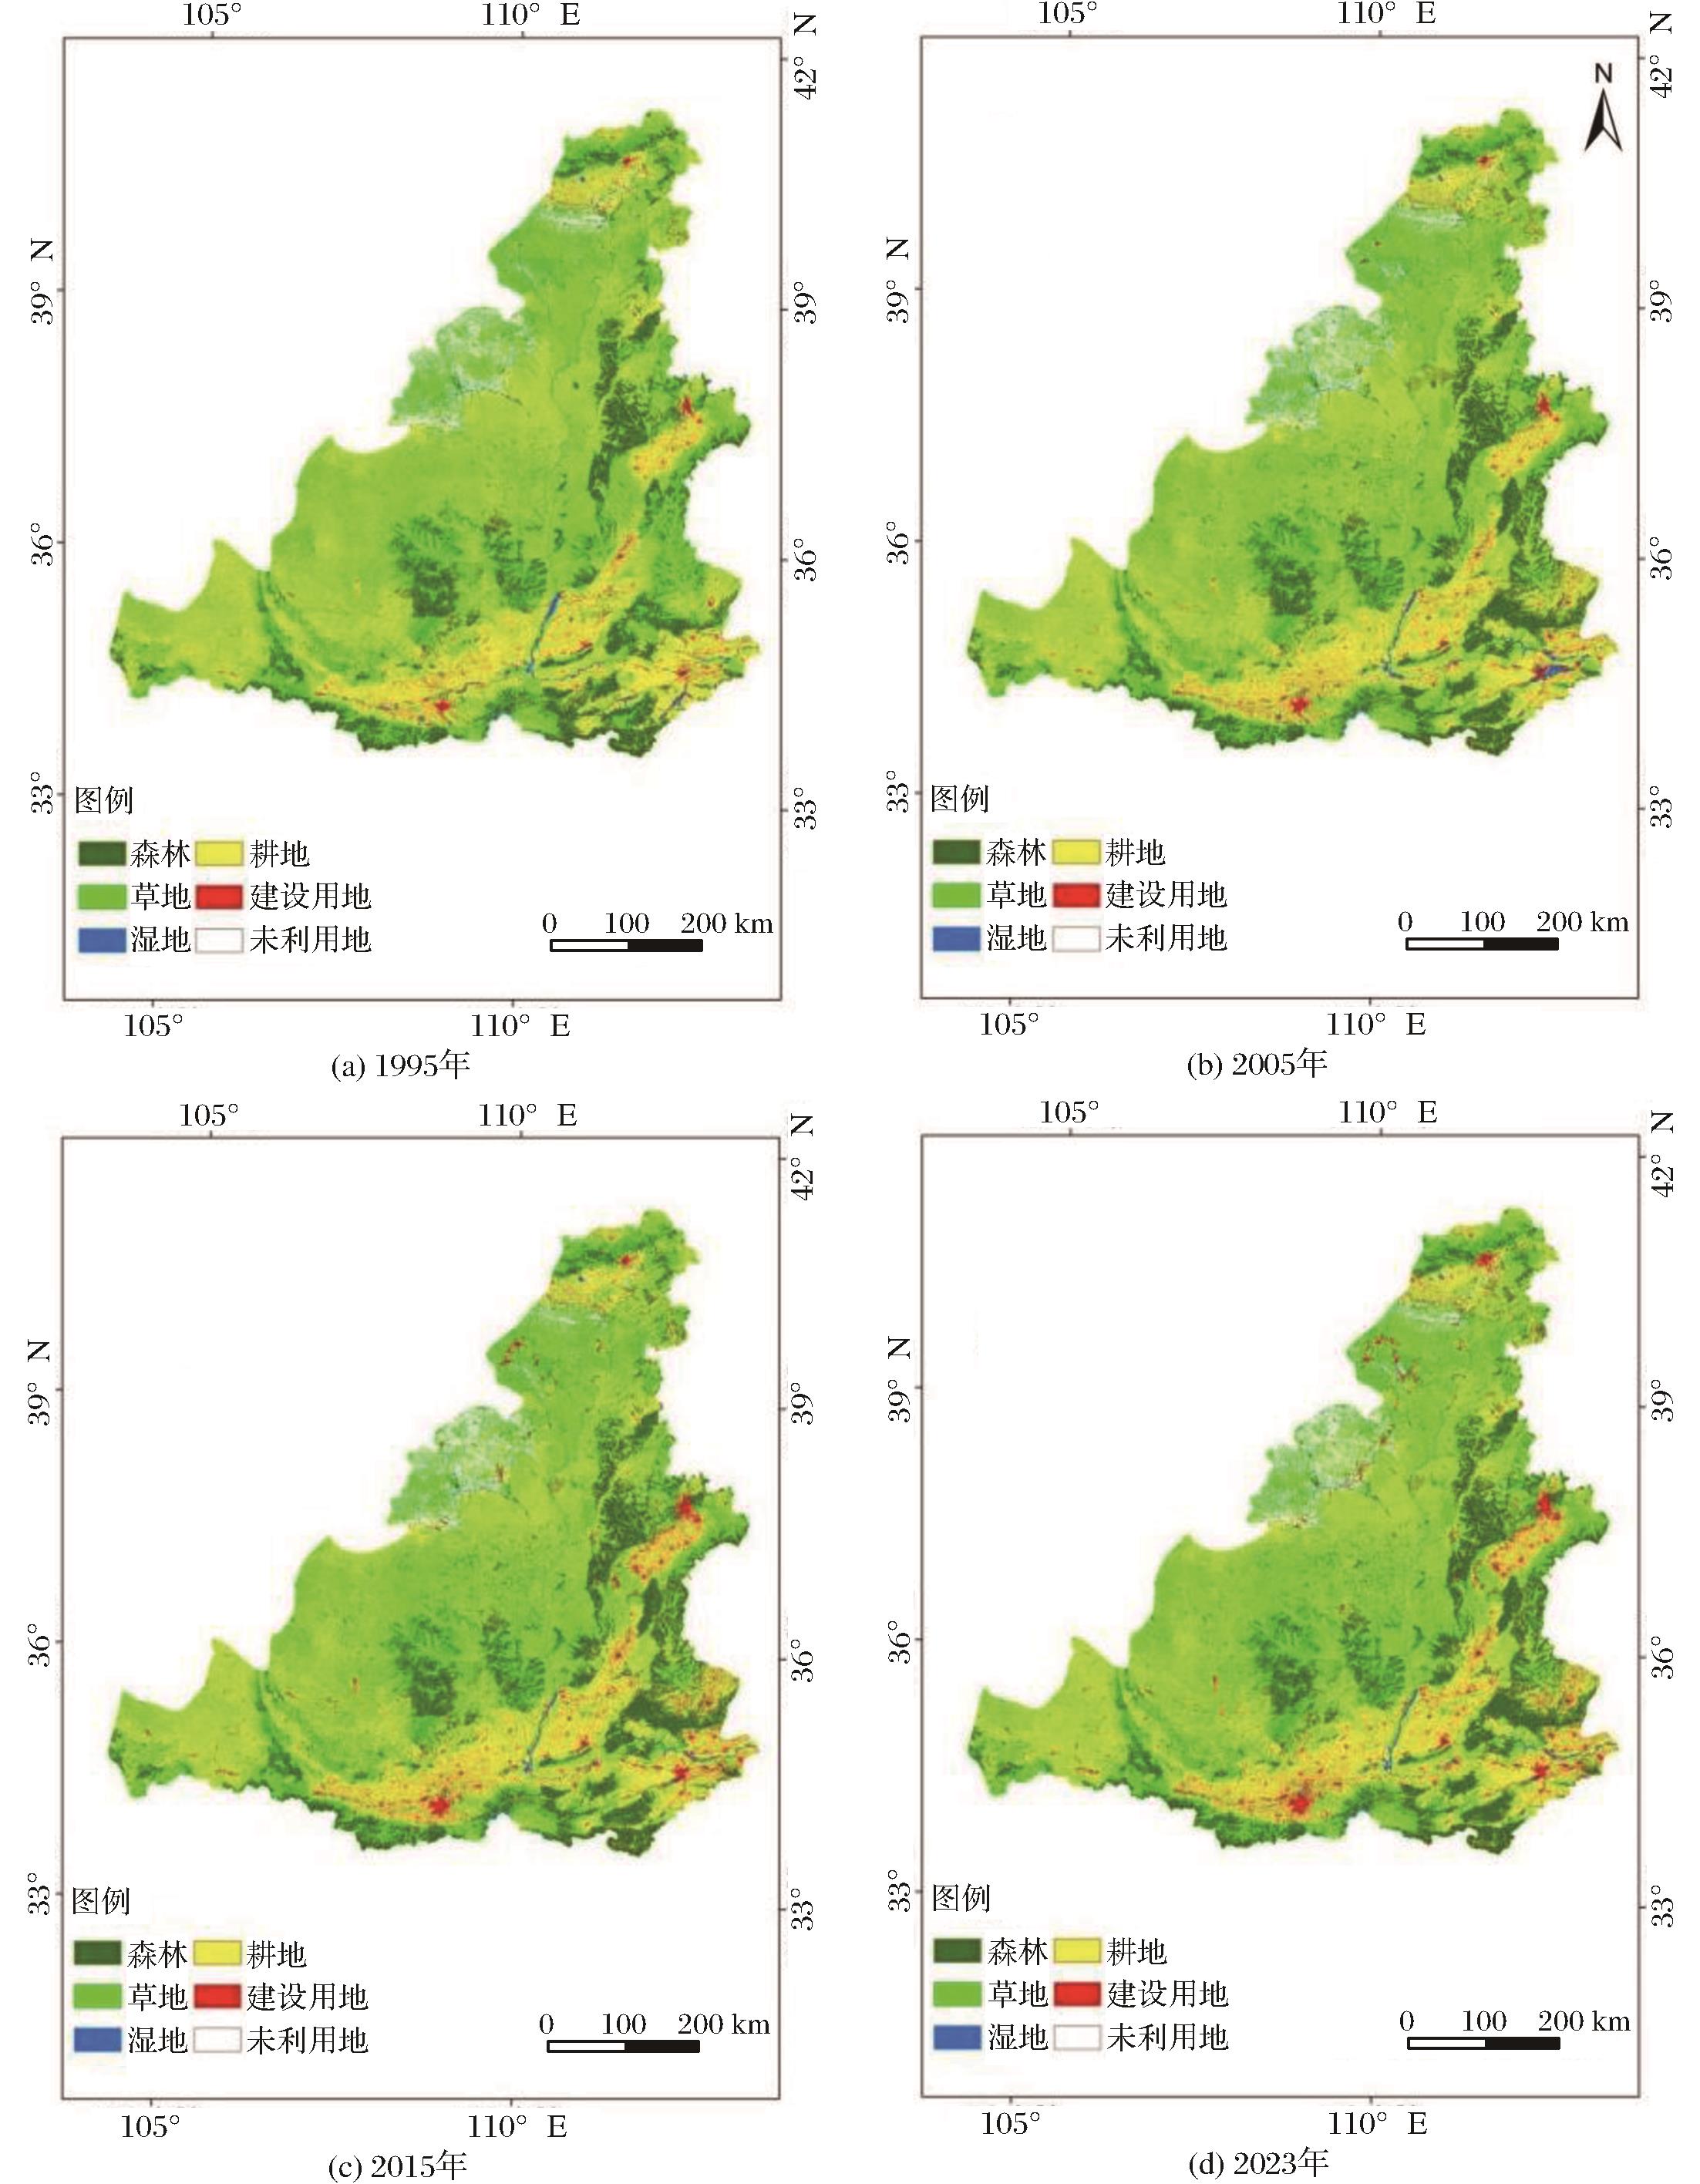
Fig.3
LULC map of the middle reaches of the Yellow River basin in four reference years
Table 5
Detailed information on LULC in the middle reaches of the Yellow River Basin in four reference years
Table 6
Historical LULC changes in the Middle reaches of the Yellow River Basin
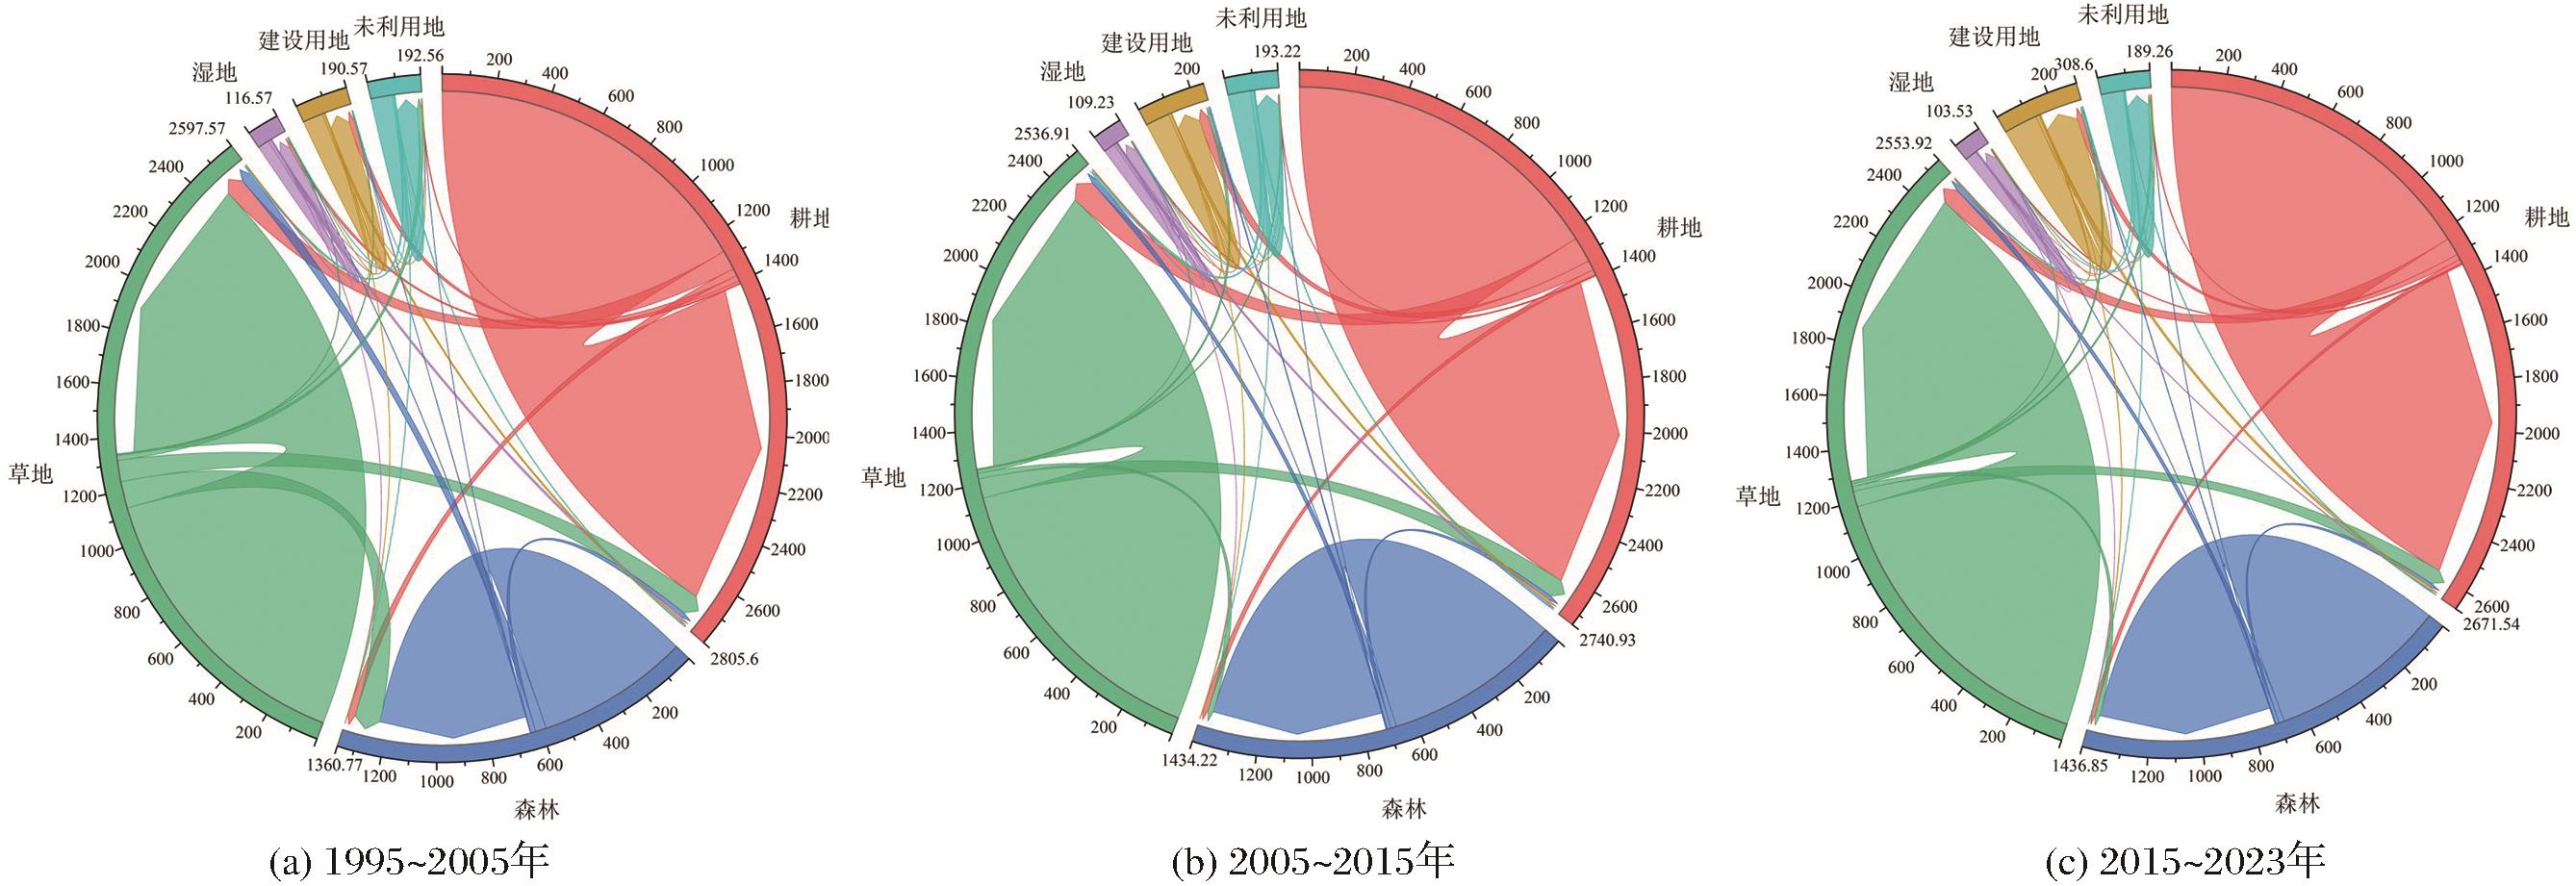
Fig.4
The chord diagram of the transfer of LULC in the middle reaches of the Yellow River from 1995 to 2023
Fig.5
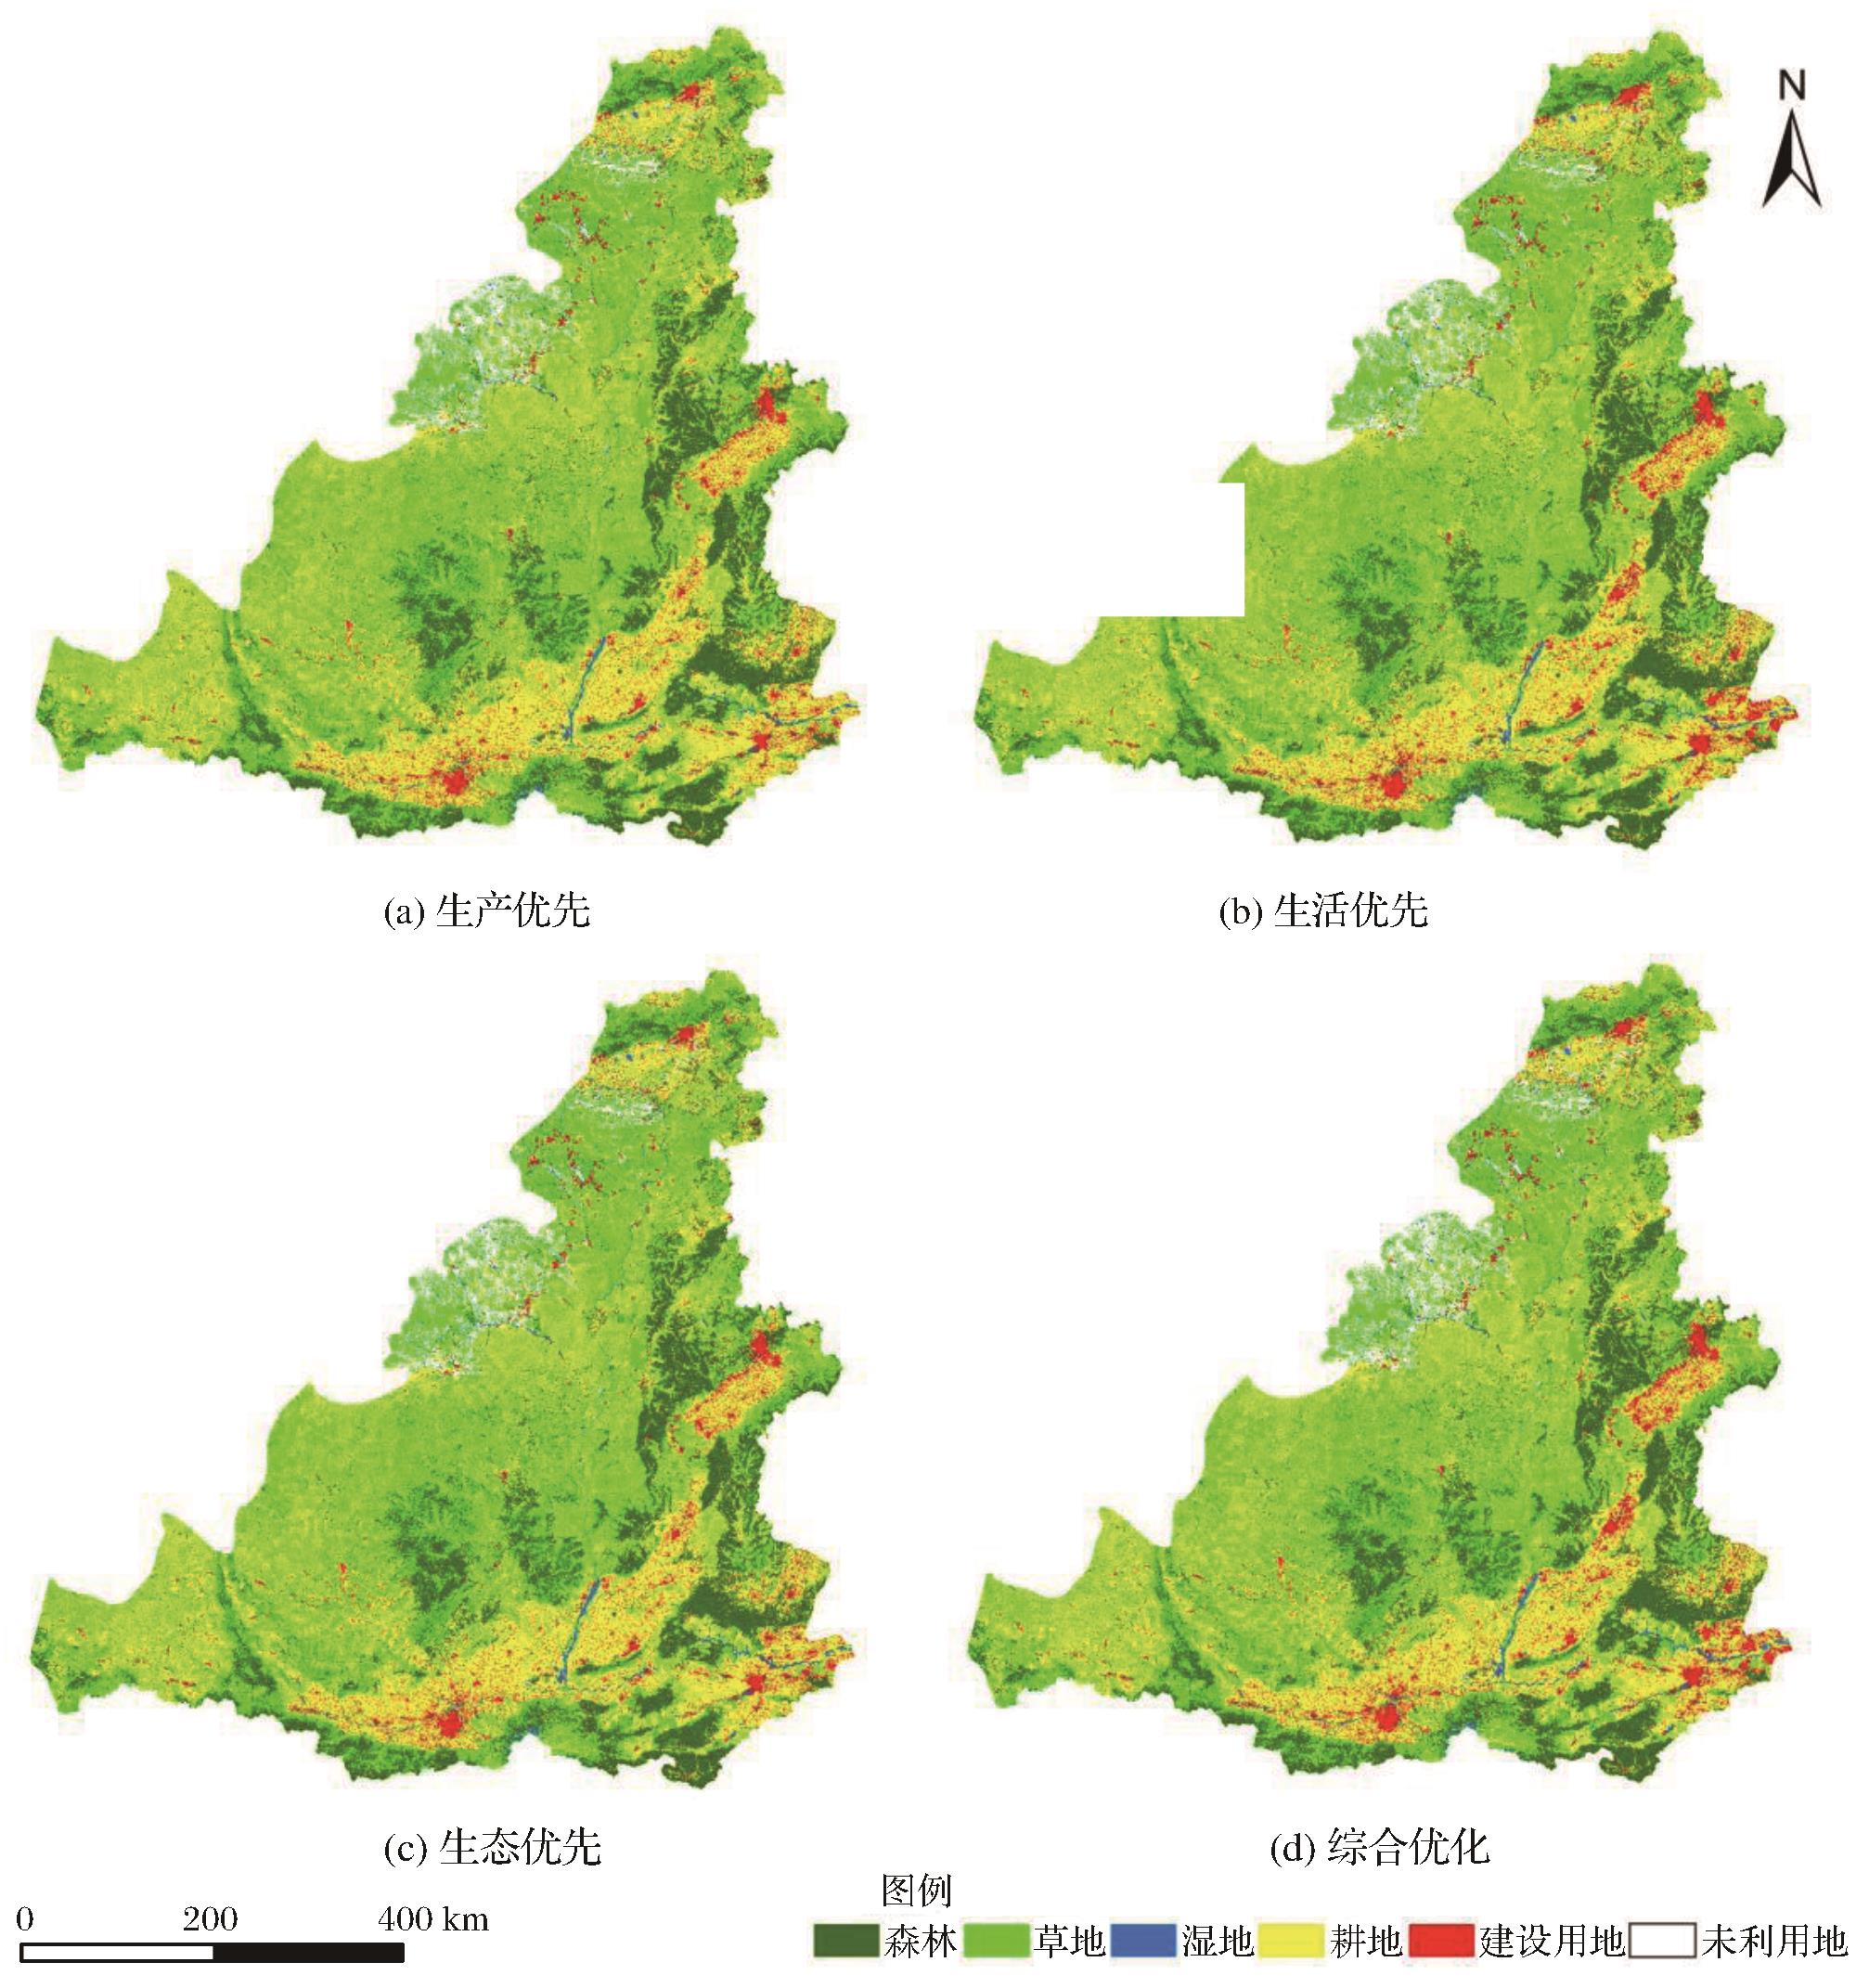
Prediction of multi-scenario spatial distribution of LULC in the middle reaches of the Yellow River in 2025
Fig.6
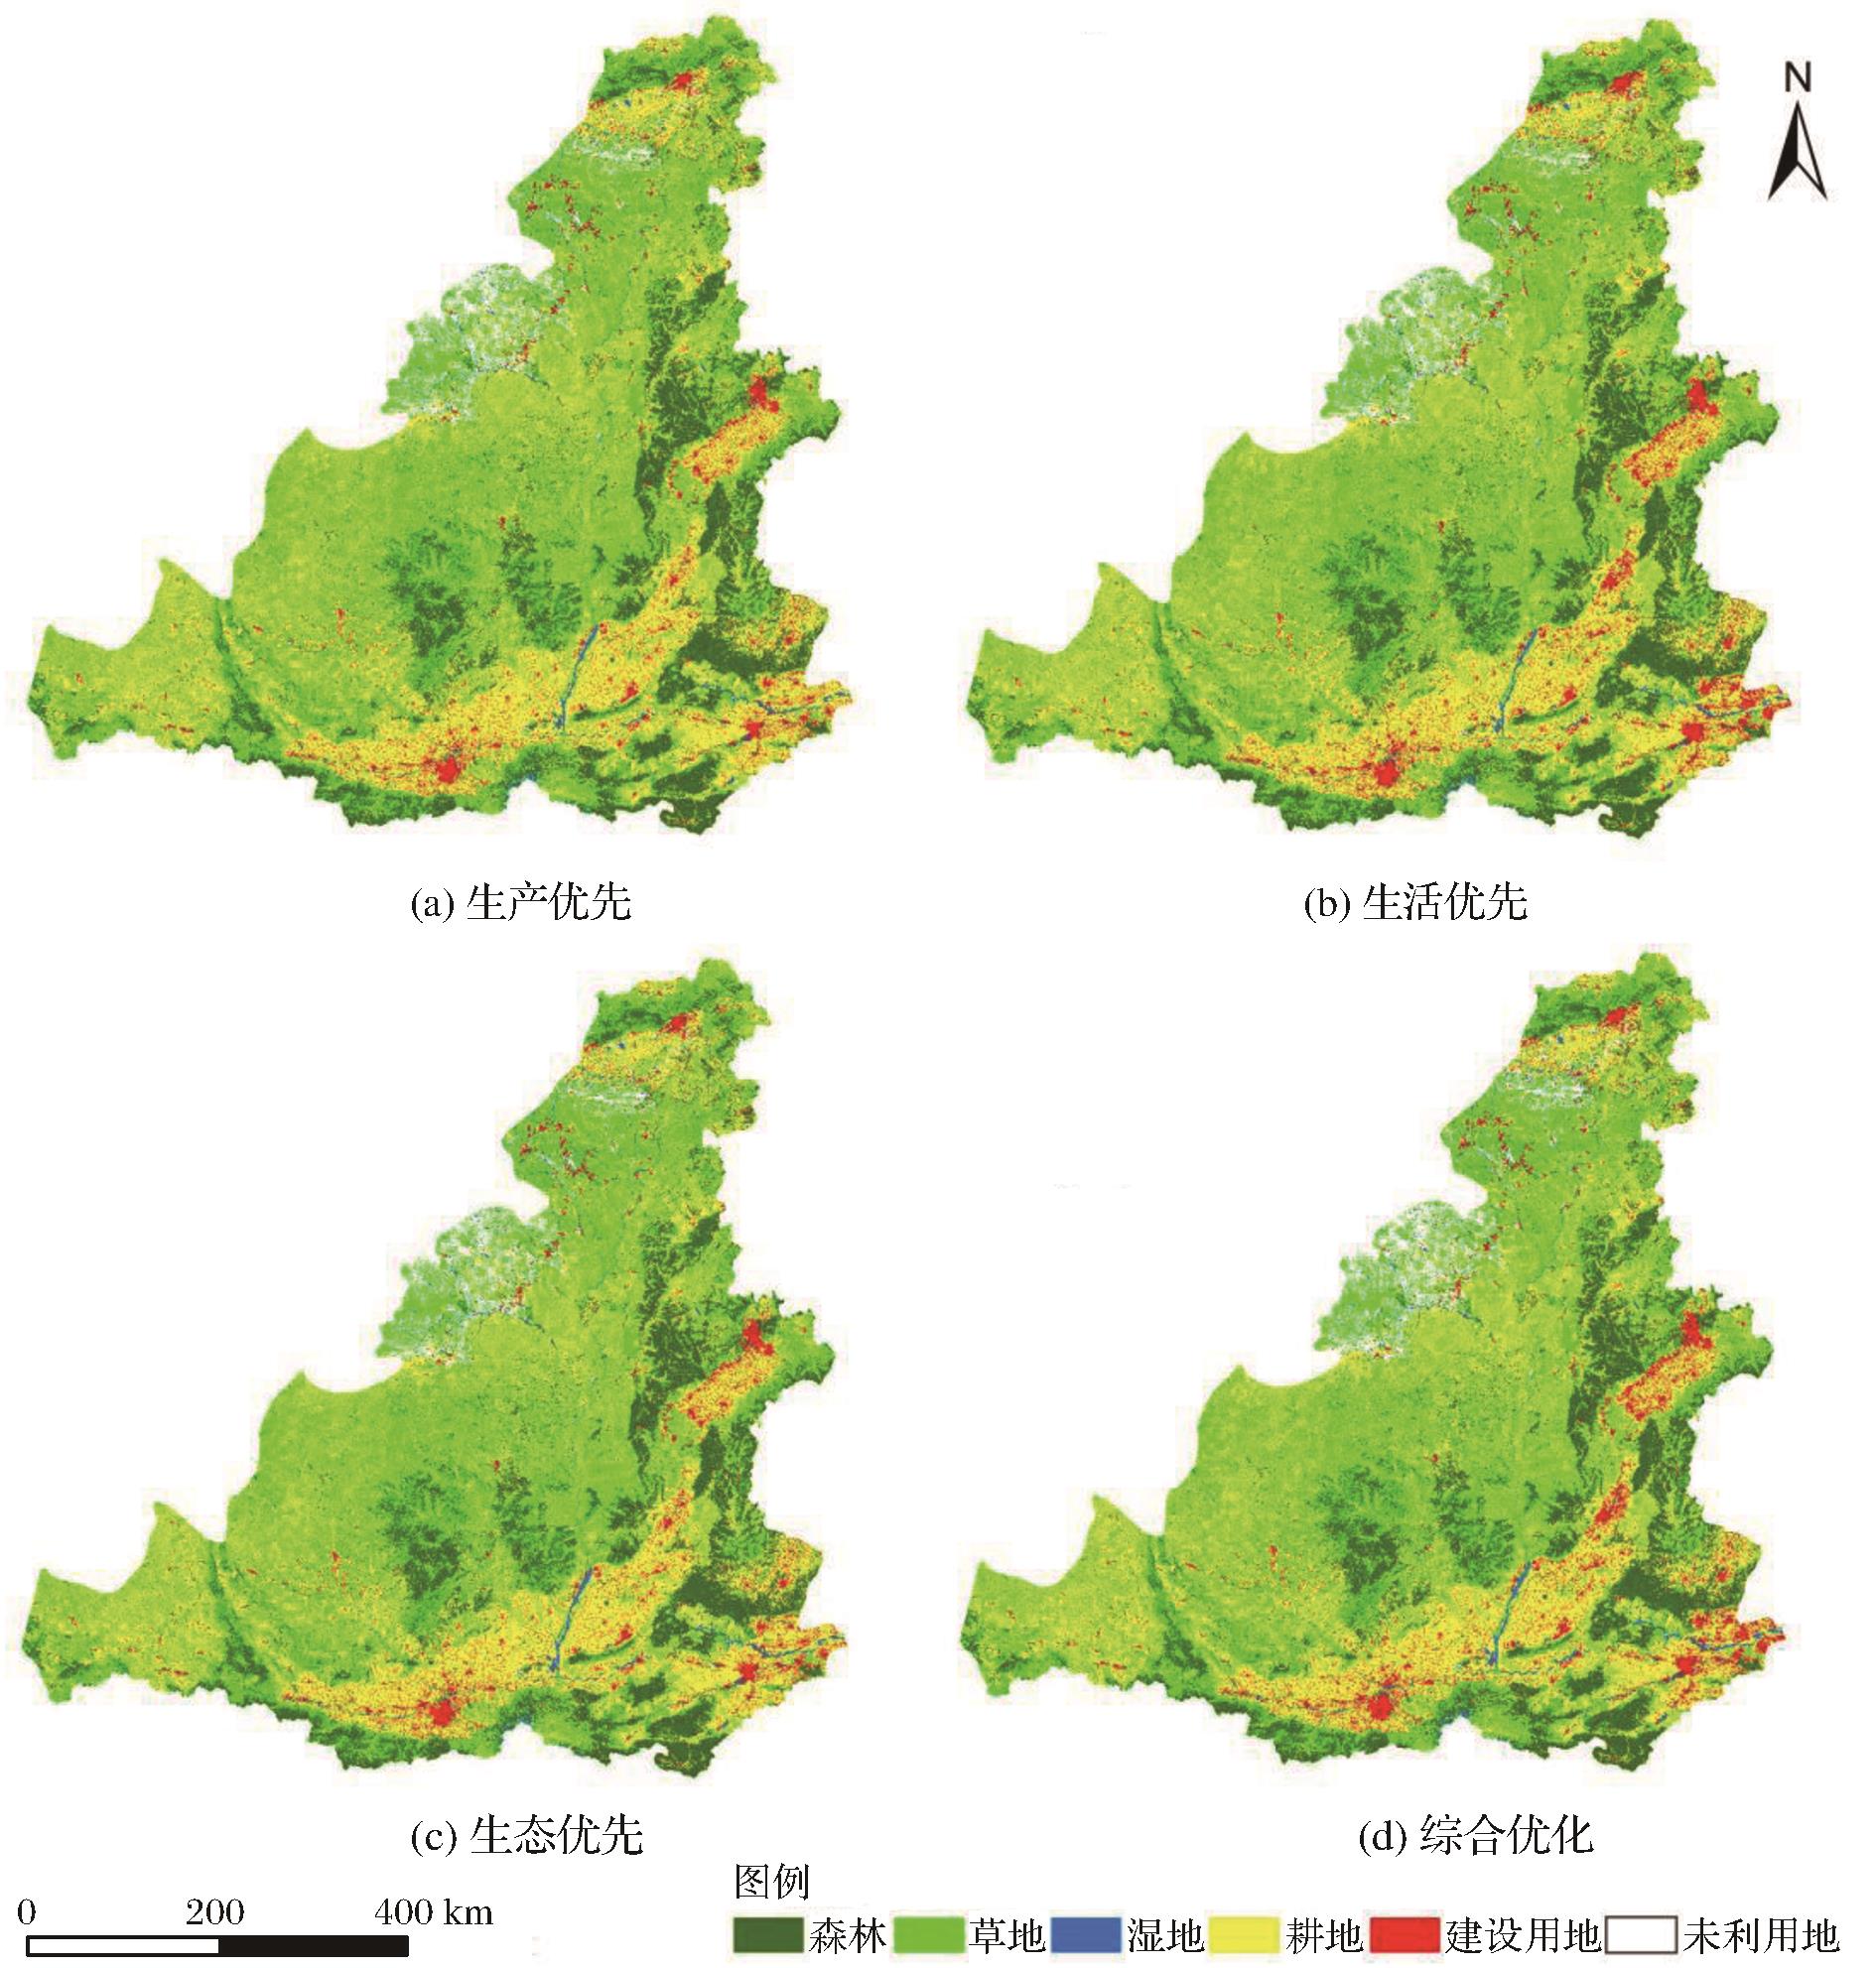
Prediction of multi-scenario spatial distribution of LULC in the middle reaches of the Yellow River in 2030
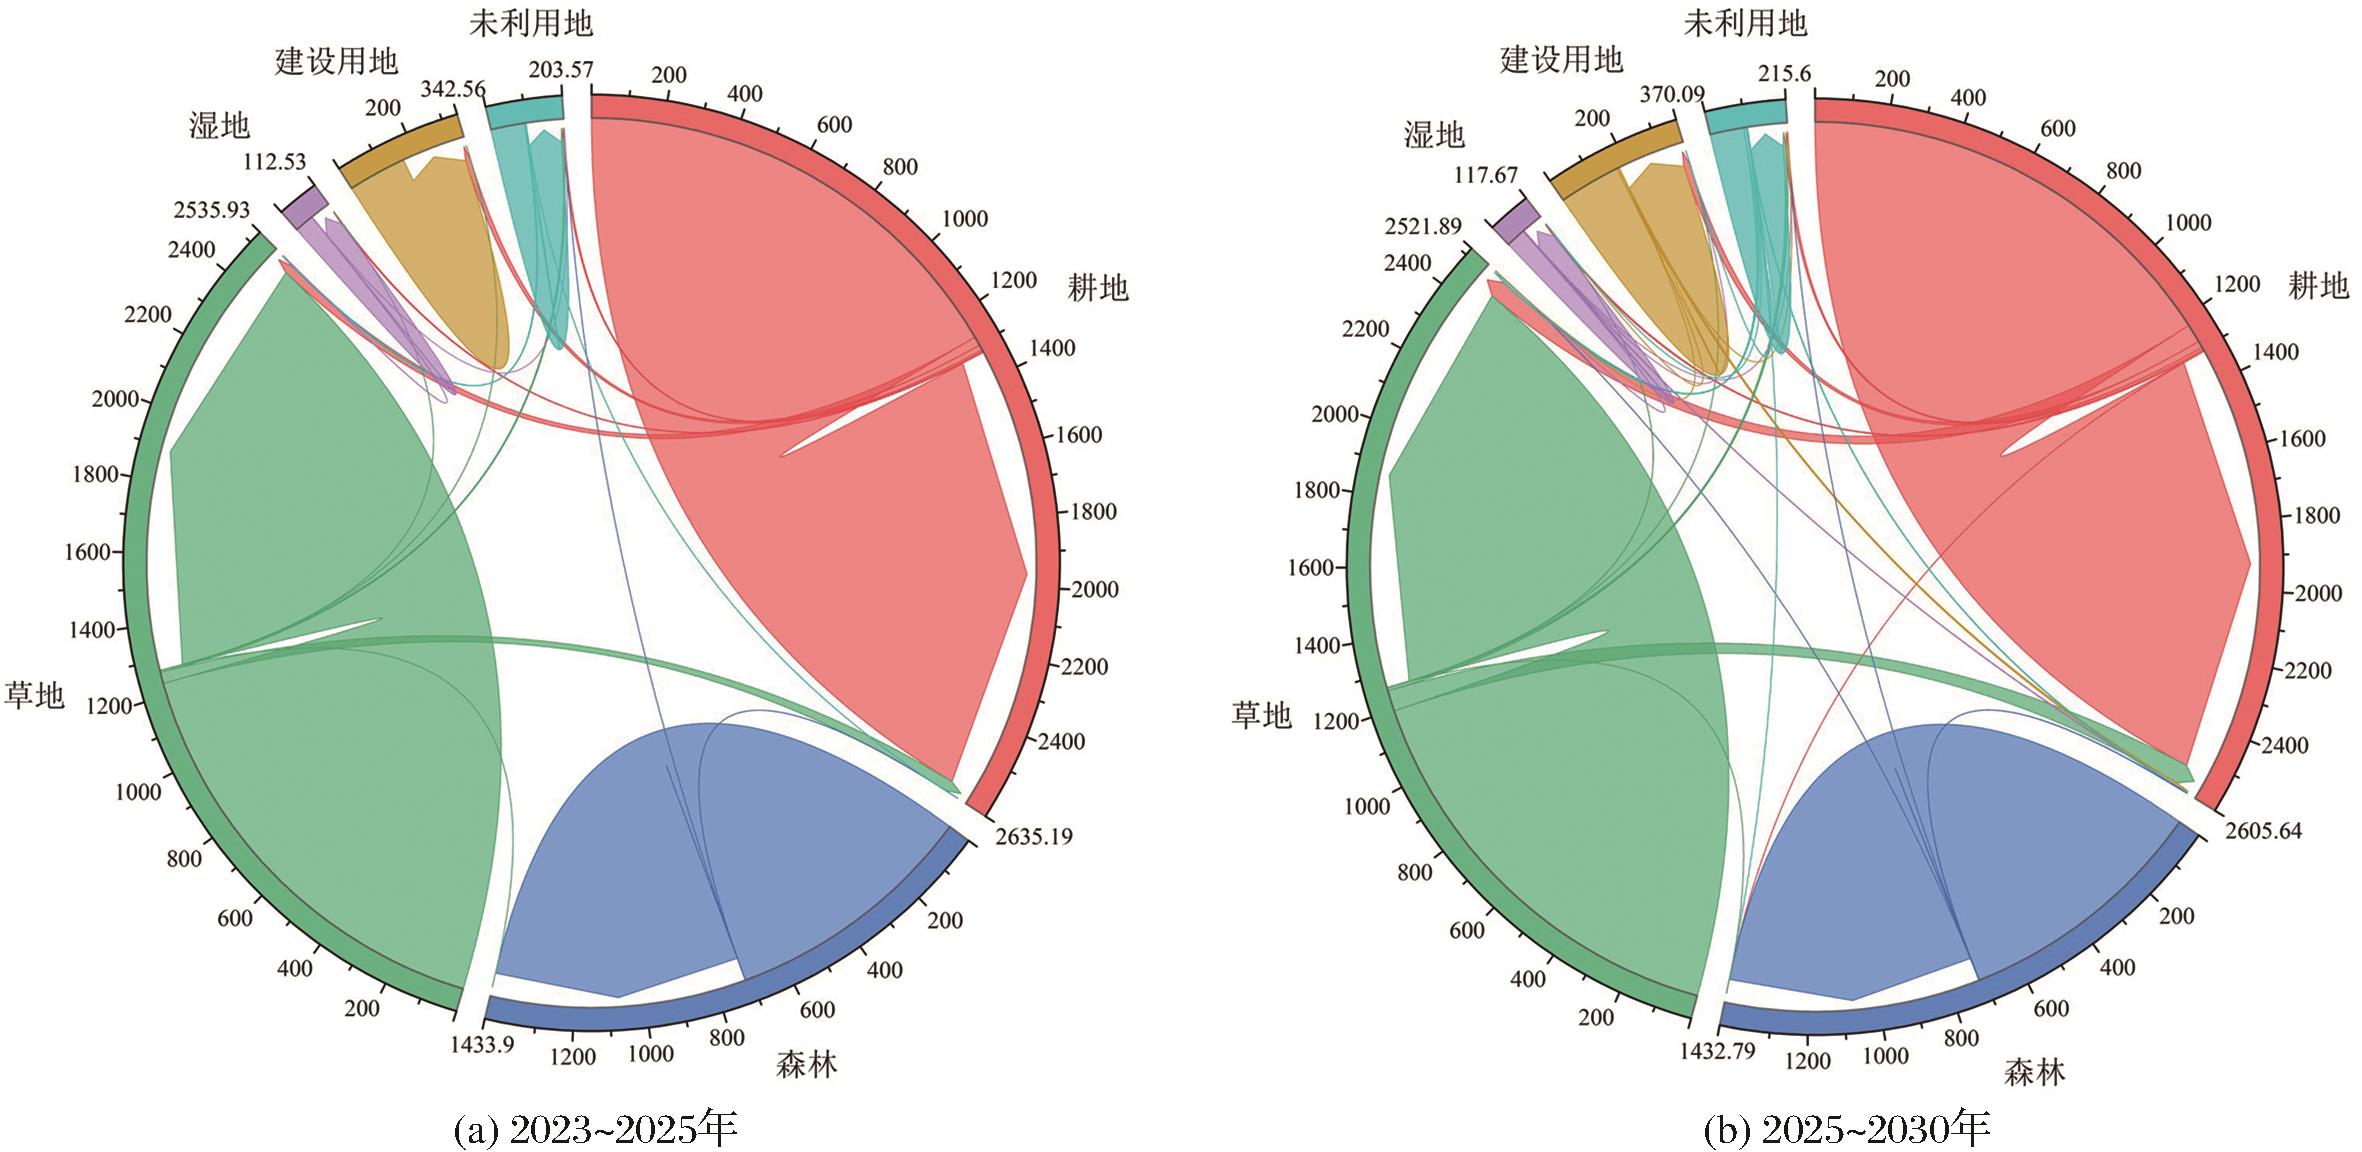
Fig.7
Prediction of LULC transfer chord diagram of the middle reaches of the Yellow River from 2023 to 2030