ISSN 1004-0323
CN 62-1099/TP
RSS
|
Email Alert
Toggle navigation
Home
About Journal
Editorial Board
Instruction
Journal Online
Current Issue
Online First
Archive
Most Read
Most Download
Most Cited
Subscription
Advertisement
Publication Ethics
Contact Us
中文
More options
Journal
DOI
ALL
Remote Sensing Technology and Application
Publication year from
To
All
1986
1987
1988
1989
1990
1991
1992
1993
1994
1995
1996
1997
1998
1999
2000
2001
2002
2003
2004
2005
2006
2007
2008
2009
2010
2011
2012
2013
2014
2015
2016
2017
2018
2019
2020
2021
2022
2023
2024
All
2024
2023
2022
2021
2020
2019
2018
2017
2016
2015
2014
2013
2012
2011
2010
2009
2008
2007
2006
2005
2004
2003
2002
2001
2000
1999
1998
1997
1996
1995
1994
1993
1992
1991
1990
1989
1988
1987
1986
Volume
Issue
Author
Affiliation
Search result
Journal
Loading ...
Publication year
Loading ...
Table 2 Feature variables for agricultural greenhouse extraction
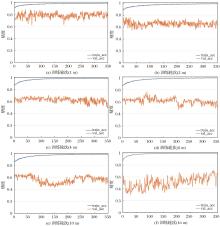
Fig.5
Fine-tuning results of CNN models on different resolution images
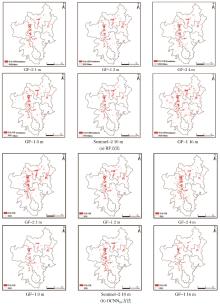
Fig.6
Greenhouse distribution based on RF method and OCNN
FT
method
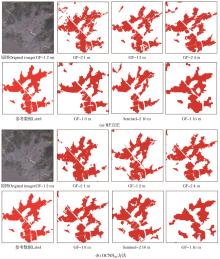
Fig. 7
Detailed diagram of classification effect of different methods
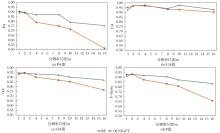
Fig.8
PA, UA, OA and F-score of agricultural greenhouses under different resolution images
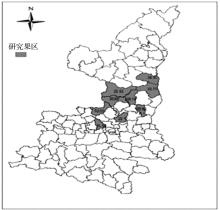
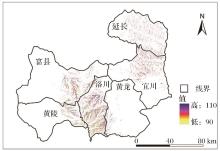
Fig.1
Overview of the study area
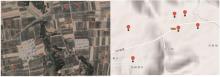
Fig.2
Location distribution of apple tree samples in Luochuan County
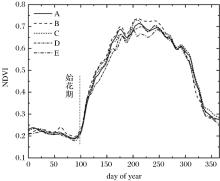
Fig.3
NDVI reference curve of fruit tree samples in Luochuan County
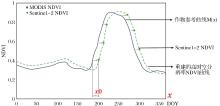
Fig. 4
Function fitting diagram of NDVI time series reconstruction based on reference curve
Fig 5
Results of flowering monitoring by remote sensing in Yan'an City
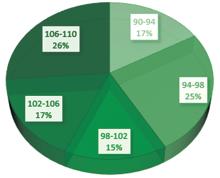
Fig 6
Proportion of initial flowering period in Yan 'an City
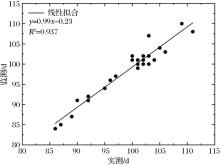
Fig.9
Regression equation
Table 5 Classification accuracy of different training samples for Indian Pines
Table 6 Classification accuracy of different training samples for PaviaU
Table 3 McNemar test results based on RF method and OCNN
FT
method(significance α=0.05)
Table 7 Impact of different spatial resolutions on the classification results of 20 tree species
Table 1 Absolute error of flowering detection results in each study area of Loess Plateau (days)
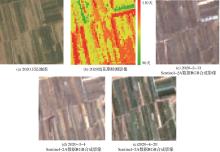
Fig.10
Spatial distribution of flowering monitoring results and Sentinel data RGB display
Fig.4
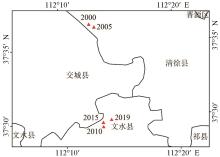
Gravity center migration of ecological vulnerability on Shanxi province from 2000 to 2019
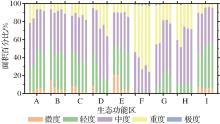
Fig.5
Percentage of ecological vulnerability under different ecological function areas
page
Page 1 of 88
Total 1758 records
First page
Prev page
Next page
Last page