


1 引 言
利用遥感技术可以有效估算农业土壤和河流沉积物中的重金属浓度[8-10]。Kooistra等[11]基于土壤重金属含量与土壤反射光谱特征波段间的高相关性,建立偏最小二乘回归(Partial Least Squares Regression,PLSR)模型对莱茵河流域冲积平原区域土壤中的Cd、Zn含量进行反演。Chodak等[12]利用多元逐步回归法对森林土壤有机质层的重金属含量进行反演。Siebielec等[13]对波兰Tamowskie Gory地区的表层土壤样品建立了Cu、Cr、Ni等含量估算模型。Ferreira等[14]运用人工神经网络法建模,对巴西某地区土壤中Cu含量进行预测。Laakso等[15]通过分析短波红外光谱与矿物、元素含量的关系,预测了某些金属的空间分布特征。偏最小二乘模型由于具有简化高光谱数据结构、可改善信息冗杂的优势,且可解决光谱波段多重相关性问题,在土壤参数反演中应用最为广泛[16-19]。
然而,目前土壤重金属遥感反演的相关研究多基于实验室实测的土壤反射光谱数据,仅有少数利用多光谱遥感影像反演土壤参数的实例,多集中于土壤PH、有机质等特征[16]。多光谱遥感影像由于波段较少、光谱分辨率较低,加之土壤重金属含量低、光谱特征微弱,利用多光谱遥感影像反演土壤重金属含量的可行性尚需研究。
因此,以山西省铜矿峪铜矿尾矿库及周边农田为研究区,利用土壤样品化学分析结果、可见光-短波红外区间反射光谱及Sentinel-2多光谱影像,建立研究区铜元素含量反演模型,探索基于多光谱影像的土壤重金属含量高精度反演方法。
2 研究区和数据
2.1 研究区概况
图1
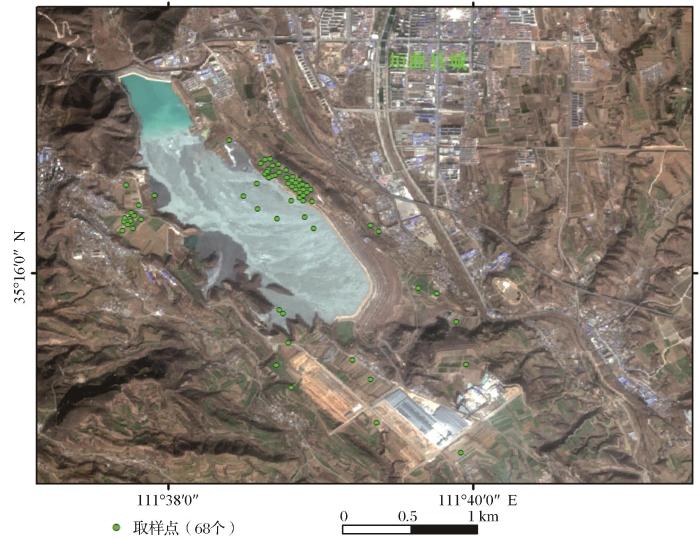
图1
2018年研究区Sentinel-2自然彩色合成影像(RGB432)和土壤样品分布
Fig.1
Sentinel-2 natural color composite image (RGB432) and soil sample distribution in the study area in 2018
2.2 数据
2.2.1 土壤样品采集与光谱数据获取
在铜矿峪铜矿尾矿库内部及周边农田进行样品定点采集,采样时根据当地农田的分布、与尾矿库距离、可到达程度、在影像中未被植被覆盖等因素综合选取了68个样点,采样点分布如图1所示。本研究共采集68个深度为0~10 cm的浅层土壤样品,重约500 g,其中包括尾矿库内部9个样品以及周边农田59个样品,并对采样点情况做好记录。
除去土壤样品中的石块、植物根系、凋落物等后晾晒风干。土壤样品的实验室光谱测量采用SR-3500便携式光谱仪,其光谱范围为350~2 500 nm,光谱采样间隔为1 nm。利用两盏溴钨灯为光源,采用视场为25º的光纤探头测量土壤光谱,使用白色硫酸钡面板提供反射校准参考。每个土壤样品测量5次,并使用平均光谱代表样品光谱[20]。
2.2.2 遥感数据与预处理
Sentinel-2卫星携带的高分辨率多光谱成像仪在可见光—短波红外范围内有13个波段,幅宽达290 km,地面分辨率分别为10、20和60 m。实验选取的影像获取时间为2018年1月1日,无云、雪且植被覆盖较少。利用欧空局的Sen2Cor工具对Sentinel-2影像进行大气校正,之后将空间分辨率为10 m和20 m共10个波段像元统一重采样至10 m。
3 研究方法
3.1 土壤铜元素含量分析
利用电感耦合等离子体原子发射光谱(ICP-AES)等方法测试了样品Cu、Pb、Zn、Cd、Cr、Ni、As、Sb、Hg共9种元素含量。根据中国生态环境部2018年发布的土壤环境质量标准(GB 15618-2018),68个样品中共有16个样品(24%)的Cu含量超过风险筛选值(100 mg/kg),仅有1个样品Cd含量超过风险筛选值(0.6 mg/kg),其余元素基本无超过风险筛选值的样品,因此选择土壤Cu含量开展研究。
土壤样品Cu含量的基本统计特征如表1所示,Cu含量变化范围为28.40~413.63 mg/kg。将采集的68个土壤样品按照约3∶1的比例划分为建模集和验证集,从样品中随机抽取48个样品作为建模样品,剩余20个样品作为验证样品,验证集样品具有较大的均值(94.87 mg/kg)和变异系数(1.05)。
表1 68件土壤样品中Cu含量的描述性统计信息(mg/kg)
Table 1
| 重金属 | 最小值 | 最大值 | 均值 | 标准差 | 变异系数 | 样品个数 |
|---|---|---|---|---|---|---|
| 全部 | 28.40 | 413.63 | 83.23 | 74.64 | 0.90 | 68 |
| 建模集 | 28.40 | 302.81 | 79.53 | 63.29 | 0.80 | 48 |
| 验证集 | 28.60 | 413.63 | 94.32 | 98.87 | 1.05 | 20 |
3.2 土壤光谱曲线特征分析
土壤样品反射光谱在400~800 nm、1 500~1 800 nm、2 100~2 400 nm范围内存在明显的差异(图2(a))。400~800 nm处的光谱差异反映了不同样品的有机质和铁氧化物含量存在差异[21];在1 500~1 800 nm处虽然无特征性吸收,但不同样品光谱曲线坡度差异明显,这些差异与样品的矿物组成、粒度等有关;大部分样品在2 200 nm均存在弱吸收带,为粘土矿物的特征吸收带[22-23];2 335 nm附近的吸收可能为绿泥石的吸收带,与斑岩铜矿床伴有绿泥石化蚀变吻合,导致铜含量高的样品光谱与其他样品光谱在此区间差异明显[24]。由于实验的目的是基于Sentinel-2影像反演研究区土壤Cu元素含量分布,因此在筛选特征波段前,利用ENVI软件的Spectral Library Resampling功能将实测光谱重采样至Sentinel-2影像波段范围(如图2(b)),重采样后样品光谱的主要特征得以保留。
图2
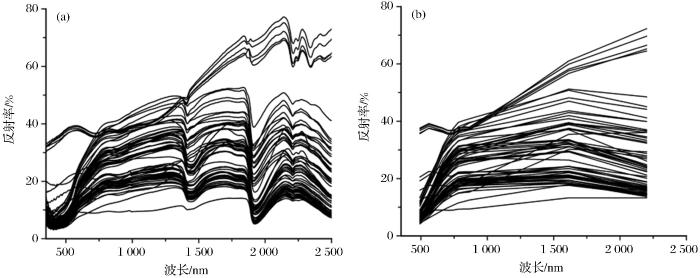
图2
68个土壤样品经平滑处理后的实验室光谱和土壤样品实测光谱重采样至Sentinel-2影像光谱范围
Fig.2
Laboratory spectra of 68 soil samples after smoothing and The measured spectrum of soil samples resampling to the Sentinel-2 image bandpass
3.3 特征波段筛选
表2 光谱变量与Cu含量相关性分析结果
Table 2
特征波段(nm) \相关性 | 原始光谱 | 均值规格化光谱 | ||
|---|---|---|---|---|
| 实测Cu含量 | Cu含量对数 | 实测Cu含量 | Cu含量对数 | |
| B2~490 | 0.45 | 0.48 | 0.68 | 0.65 |
| B3~560 | 0.36 | 0.39 | 0.67 | 0.63 |
| B7~783 | -0.09 | -0.08 | -0.71 | -0.79 |
| B8~865 | -0.10 | -0.10 | -0.73 | -0.70 |
| B12~2 190 | 0.34 | 0.36 | 0.58 | 0.59 |
3.4 模型建立
3.4.1 偏最小二乘回归模型
利用PLSR对48个样品的Cu含量值与重采样后5个特征波段的反射光谱进行建模,对研究区土壤Cu含量进行预测,回归模型如下:
Y=108.2175+B2*13.7848+B3*2.8460-B7*
4.3600-B8*4.2889+B12*1.5516
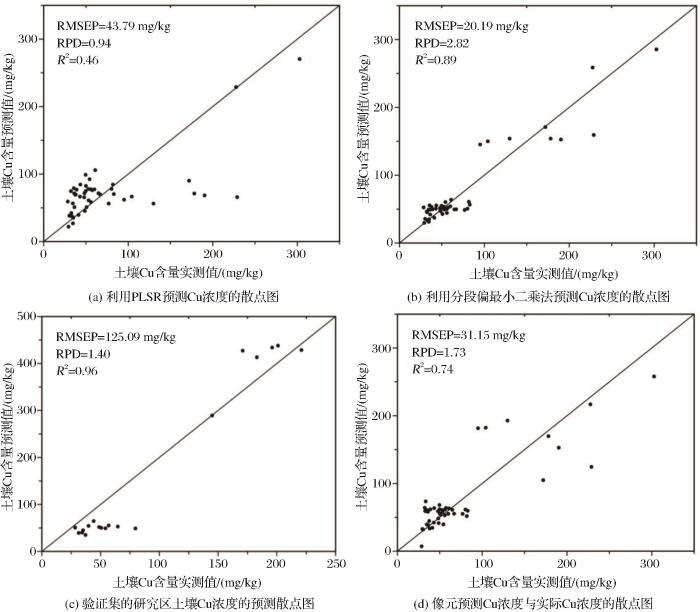
建模结果如图3(a)所示,利用基本偏最小二乘法建立的反演模型决定系数R2仅为0.46,均方根误差RMSE较高(43.79 mg/kg),且RPD<1.4,表明该模型无法对样品进行预测。
图3
3.4.2 分段偏最小二乘回归模型
为解决基本PLSR无法有效反演本区土壤Cu含量的问题,提出了分段偏最小二乘回归法(Piecewise Partial Least Squares Regression,P-PLSR)。根据中国生态环境部2018年发布的土壤环境质量标准(GB 15618-2018),土壤中Cu浓度的背景值为100 mg/kg,高于100 mg/kg则划定为污染区。本区土壤光谱分析表明,本区Cu浓度高值样品均存在2 200、2 250、2 335 nm的吸收特征,而低值样品则仅在2 200 nm存在吸收特征(图2),高值、低值样品光谱曲线形态差异较大,无法用统一的模型进行精确预测。因此将样品以100 mg/kg为界限,分为低于100 mg/kg(未污染)和高于100 mg/kg(污染)两部分,将两部分样品分别采用PLSR建立模型。
将48个样品以100 mg/kg为阈值分为两部分,包括9个高于背景值的样品(污染)以及39个低于背景值的样品(未污染)。将两组样品的Cu含量值与重采样后5个特征波段反射光谱分别利用PLSR进行建模,得到回归模型Y高值与Y低值,再将回归模型的结果进行整合。回归模型如下:
Y低值=65.8127+B2*1.7099+B3*0.8088-B7*1.4339-B8a*1.3671+B12*1.3274
Y高值=176.7753+B2*6.2382+B3*2.7489-B7*3.0351-B8a*3.0564+B12*2.1678
4 研究结果与分析
4.1 地面样品光谱分析结果
4.2 土壤铜含量遥感反演
图4
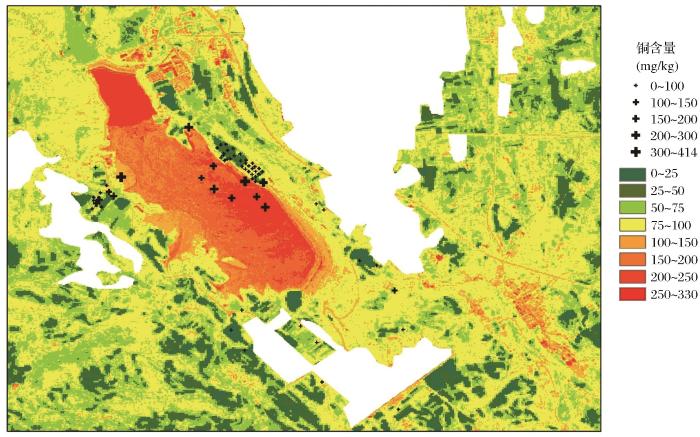
图4
研究区Sentinel-2遥感数据土壤Cu浓度反演结果图
Fig.4
Predicting result of soil Cu concentration from Sentinel-2 remote sensing data in the study area
根据野外取样点坐标在结果图像上提取各点的反演值(即模型预测值),获得了训练集48个反演值与相应Cu含量实测值的散点图(图3(d))。由图3(d)可以得知,利用分段偏最小二乘法建模处理Sentinel-2遥感影像所获得的像元反演值与相应Cu含量实测值散点图的R2为0.74,RMSE为31.15 mg/kg,RPD为1.73。结果表明,利用分段偏最小二乘法建立的模型处理Sentinel-2影像所获得的铜含量结果,具有高R2和RPD以及低RMSE,即该模型应用到Sentinel-2遥感影像上也同样具有较好的稳定性、较高拟合程度以及较好的预测能力,证实了利用Sentinel-2遥感影像反演土壤铜浓度的可行性。
根据研究区Sentinel-2遥感影像获得的土壤Cu含量反演结果(图4),表明铜元素在研究区内的分布具有如下特征:①尾矿库的内部整体呈红色,说明铜含量整体偏高,明显高于周边土壤中铜元素含量,与实际情况相符;②在尾矿库周边的部分农田里,土壤铜浓度已超过标准背景值100 mg/kg,尤其在研究区的东南部,农田土壤铜污染较为严重且展布具有沿尾矿库向南东方向延伸的明显规律,与该尾矿库东南部2000年发生的溃坝事件所导致的带状延伸的污染条带吻合。
实验尝试利用Sentinel-2多光谱遥感影像和少量非均匀分布的土壤样品,获得了基于遥感影像的土壤Cu含量反演结果且精度较高,证实了利用Sentinel-2多光谱影像进行土壤铜含量反演具有可行性,本结果可以为区内土壤污染调查、监测和治理提供一定的依据。然而,实验中的样品空间分布不均匀,特别是高值样品相对较少,分为建模集、验证集后各自的高值样品更少,后续研究可以适当增加高值样品数量,确保结果在统计意义上更加稳健。
5 结 论
(1)对实测土壤光谱反射率进行均值规格化处理,对Cu含量进行对数变换,可以有效的提高土壤Cu含量与反射光谱之间的相关性。其中波段B7的光谱反射率与Cu含量的相关性从-0.09提高到-0.79。
(2)利用分段偏最小二乘法建模,有效改善了基本偏最小二乘法无法预测本区Cu含量的问题,提高了模型的预测精度,使最终的模型稳定性更好、拟合程度更高、预测精度更好。利用分段偏最小二乘法处理重采样至Sentinel-2波段的实测光谱建模反演Cu含量的估算精度R2达到0.89(RPD=2.82)。
(3)通过分段偏最小二乘法建立的模型还可以扩展应用于Sentinel-2多光谱遥感影像,预测结果的R2为0.74,实现基于多光谱影像的土壤Cu含量制图,为研究区大面积、高精度土壤Cu元素含量调查提供可行性方法。
参考文献
Distribution and environment quality evaluation of heavy metals in soil in Shunyi of Beijing, China
[J].
北京顺义区土壤重金属分布与环境质量评价
[J].
Employing elevation data for efficient mapping of soil pollution on floodplains
[J].
Near- and mid-infrared diffuse reflectance spectroscopy for measuring soil metal content
[J].
Visible, near infrared, mid infrared or combined diffuse reflectance spectroscopy for simultaneous assessment of various soil properties
[J].
Laboratory evaluation of a proximal sensing technique for simultaneous measurement of soil clay and water content
[J].
Special issue ‘diffuse reflectance spectroscopy in soil science and land resource assessment’
[J].
Hyperspectral estimation of heavy metal Cu content in soil based on partial least square method
[J].
基于偏最小二乘的土壤重金属铜含量高光谱估算
[J].
Rapid identification of soil cadmium pollution risk at regional scale based on visible and near-infrared spectroscopy
[J].
Prediction of low heavy metal concentrations in agricultural soils using visible and near-infrared reflectance spectroscopy
[J].
Possibilities of reflectance Spectroscopy for the assessment of contaminant elements in suburban soils
[J].
Possibilities of visible–near-infrared spectroscopy for the assessment of soil contamination in river floodplains
[J].
Use of near infrared spectroscopy to determine biological and chemical characteristics of organic layers under spruce and beech stands
[J].
Near- and mid-infrared diffuse reflectance spectroscopy for measuring soil metal content
[J].
Artificial neural network for Cu quantitative determination in soil using a portable Laser induced breakdown spectroscopy system
[J].
Short-wave infrared spectral and geochemical characteristics of hydrothermal alteration at the Archean Izok Lake Zn-Cu-Pb-Ag Volcanogenic massive sulfide deposit, Nunavut, Canada: application in cxploration target vectoring
[J].
Digital mapping of soil properties using multivariate statistical analysis and ASTER data in an arid region
[J].
Use of near-infrared reflectance spectroscopy in prediction of heavy metals in freshwater sediment by their association with organic matter
[J].
Partial least squares based band selection for hyperspectral imagery
[J].
基于偏最小二乘法的高光谱图像波段选择
[J].
Spectroscopic analysis of soil metal contamination around a derelict mine site in the Blue Mountains, Australia
,
Estimate of heavy metal contamination in soils after a mining accident using reflectance spectroscopy
.[J].
A preliminary research of geographic regionalization of China land background and spectral characteristics
[J].
中国陆地背景和土壤光谱反射特性的地理分区的初步研究
[J].
Near-infrared analysis as a rapid method tosimulnateously evaluate several soil propetries
[J].
A preliminary study on identification of clay minerals in soils with reference to reflectance spectra
[J].
Multivariate analysis of laboratory spectra for the assessment of soil development and soil degradation in the Southern Apennines (Italy)
[J].
Visible and near-infrared reflectance spectroscopy—an alternative for monitoring soil contamination by heavy metals
[J].
The Multivariate calibration problem in chemistry solved by the PLS method
[J].
NIR and DRIFT-MIR spectrometry of soils for predicting soil and crop parameters in a flooded field
[J].
Testing of the region of murcia soils by near infrared diffuse reflectance spectroscopy and chemometrics
[J].
Analysis of visible and near-infrared spectra of as-contaminated soil in croplands beside mines
[J].
矿区农田土壤砷污染的可见—近红外反射光谱分析研究
[J].
Potential for onsite and online analysis of pig manure using visible and near infrared reflectance spectroscopy
[J].
Critical review of chemometric indicators commonly used for assessing the quality of the prediction of soil attributes by NIR spectroscopy
[J].
Potential for onsite and online analysis of pig manure using visible and near infrared reflectance spectroscopy
[J].
Comparing different multivariate calibration methods for the determination of soil organic carbon pools with visible to near infrared spectroscopy
[J].
